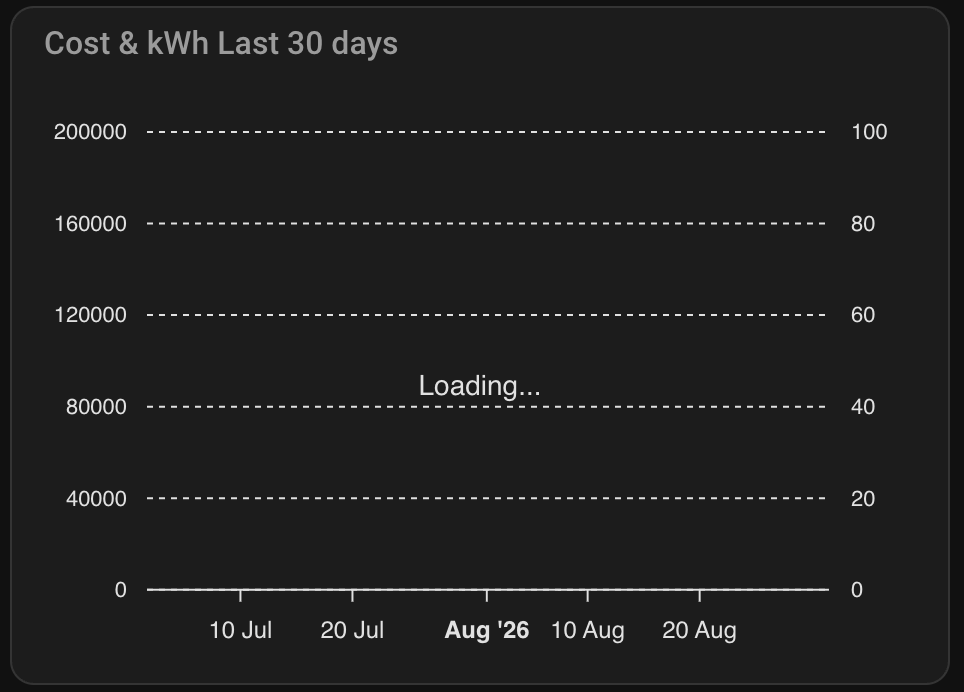
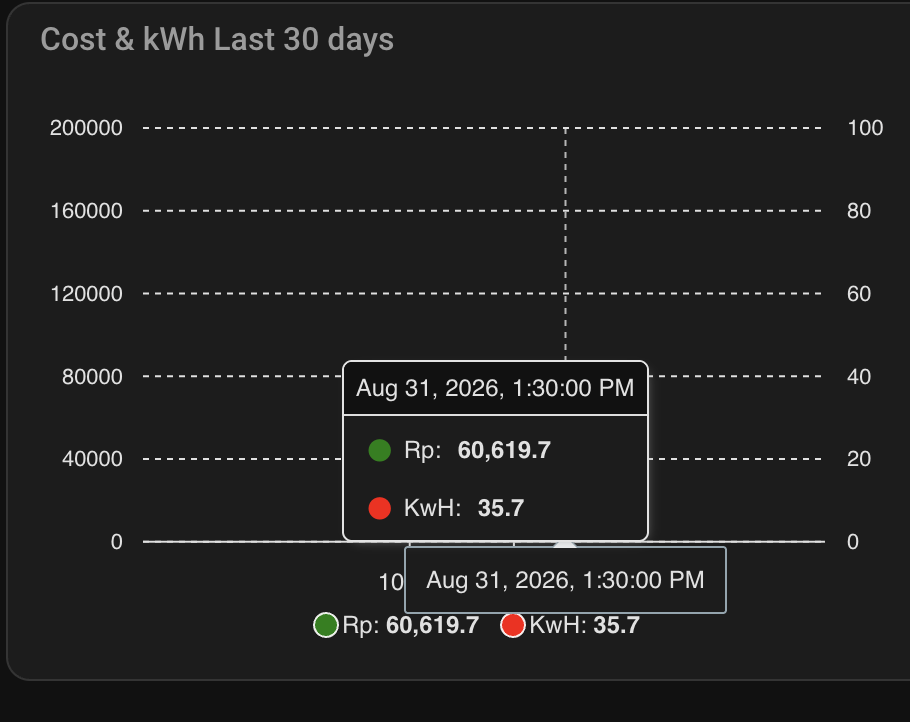
I want to display monthly energy with the cost. Now is september but why the bar in the card stored on 31 Aug?
type: custom:apexcharts-card
graph_span: 3month
span:
  end: month
header:
  show: true
  title: Cost & kWh Last 30 days
yaxis:
  - id: first
    decimals: 0
    apex_config:
      tickAmount: 5
    min: 0
    max: 200000
  - id: second
    opposite: true
    decimals: 0
    apex_config:
      tickAmount: 5
    min: 0
    max: 100
all_series_config:
  stroke_width: 2
  type: column
series:
  - entity: input_text.monthly_kwh
    yaxis_id: first
    show:
      header_color_threshold: true
      extremas: true
    type: column
    color: green
    name: Rp
    group_by:
      func: last
      duration: 1month
  - entity: sensor.utility_energy_monthly
    yaxis_id: second
    color: red
    show:
      header_color_threshold: true
      extremas: true
    type: column
    name: KwH
    group_by:
      func: last
      duration: 1month