tom_l
May 10, 2019, 12:54pm
1
I’m trying to add a border to a vertical-stack-in-card but end up with this:
The configuration looks like this:
I tried exactly the same format with an entities card and the border worked as expected:
type: 'custom:card-modder'
style:
  border: solid 5px var(--primary-color)
card:
  type: entities
  entities:
    - entity: switch.acrc_power
    - entity: switch.dishwasher
    - entity: switch.dining_heater_north
    - entity: switch.dining_heater_west
    - entity: switch.lounge_dehumidifier
    - entity: switch.lounge_pc_monitor
    - entity: switch.rumpus_dehumidifier
    - entity: switch.spare_bedroom_heater
    - entity: switch.washing_machine
    - entity: switch.wake_up_cinema_pc
  show_header_toggle: false
  title: Appliance Switches
Does card-modder not work with the vertical-stack-in-card?
tom_l
May 11, 2019, 5:50pm
2
Sorry to bug you @thomasloven but can you tell me what I’m doing wrong?
Try adding recurse: false.
tom_l
May 12, 2019, 5:21am
4
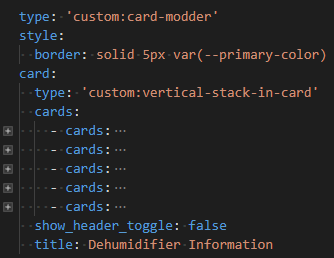
Same result unfortunately.
type: 'custom:card-modder'
recurse: false
style:
  border: solid 2px var(--primary-color)
card:
  type: 'custom:vertical-stack-in-card'
  cards:
    - cards:
        - type: 'custom:card-modder'
          style:
            border: solid 2px var(--primary-color)
            transform: scale(0.95)
          card:
            color_thresholds:
              - color: '#0da035'
                value: -1
              - color: '#e0b400'
                value: 1800
              - color: '#e45e65'
                value: 2100
            entities:
              - sensor.lounge_dehumidifier_power
            group: false
            hour24: true
            line_width: 2
            name: Lounge
            points_per_hour: 60
            show:
              icon: false
              labels: false
              name: true
              state: true
            type: 'custom:mini-graph-card'
        - type: 'custom:card-modder'
          style:
            border: solid 2px var(--primary-color)
            transform: scale(0.95)
          card:
            type: 'custom:mini-graph-card'
            color_thresholds:
              - color: '#0da035'
                value: -1
              - color: '#e0b400'
                value: 1800
              - color: '#e45e65'
                value: 2100
            entities:
              - sensor.rumpus_dehumidifier_power
            group: false
            hour24: true
            line_width: 2
            name: Rumpus
            points_per_hour: 60
            show:
              icon: false
              labels: false
              name: true
              state: true
      type: horizontal-stack
    - cards:
        - type: 'custom:card-modder'
          style:
            border: solid 2px var(--primary-color)
            transform: scale(0.95)
          card:
            color_thresholds:
              - color: '#039BE5'
                value: -1
              - color: '#0da035'
                value: 50
              - color: '#e0b400'
                value: 60
              - color: '#e45e65'
                value: 70
            entities:
              - sensor.lounge_room_condensation_chance
            group: false
            hour24: true
            line_width: 2
            name: Condensation Chance
            points_per_hour: 12
            show:
              icon: true
              labels: false
              name: true
              state: true
            type: 'custom:mini-graph-card'
        - type: 'custom:card-modder'
          style:
            border: solid 2px var(--primary-color)
            transform: scale(0.95)
          card:
            color_thresholds:
              - color: '#039BE5'
                value: -1
              - color: '#0da035'
                value: 50
              - color: '#e0b400'
                value: 60
              - color: '#e45e65'
                value: 70
            entities:
              - sensor.rumpus_room_condensation_chance
            group: false
            hour24: true
            line_width: 2
            name: Condensation Chance
            points_per_hour: 12
            show:
              icon: true
              labels: false
              name: true
              state: true
            type: 'custom:mini-graph-card'
      type: horizontal-stack
    - cards:
        - type: 'custom:card-modder'
          style:
            border: solid 2px var(--primary-color)
            transform: scale(0.95)
          card:
            color_thresholds:
              - color: '#039BE5'
                value: -1
              - color: '#0da035'
                value: 50
              - color: '#e0b400'
                value: 65
              - color: '#e45e65'
                value: 80
            entities:
              - sensor.lounge_room_humidity
            group: false
            hour24: true
            line_width: 2
            name: Humidity
            points_per_hour: 12
            show:
              icon: true
              labels: false
              name: true
              state: true
            type: 'custom:mini-graph-card'
        - type: 'custom:card-modder'
          style:
            border: solid 2px var(--primary-color)
            transform: scale(0.95)
          card:
            color_thresholds:
              - color: '#039BE5'
                value: -1
              - color: '#0da035'
                value: 50
              - color: '#e0b400'
                value: 65
              - color: '#e45e65'
                value: 80
            entities:
              - sensor.rumpus_room_humidity
            group: false
            hour24: true
            line_width: 2
            name: Humidity
            points_per_hour: 12
            show:
              icon: true
              labels: false
              name: true
              state: true
            type: 'custom:mini-graph-card'
      type: horizontal-stack
    - cards:
        - type: 'custom:card-modder'
          style:
            border: solid 2px var(--primary-color)
            transform: scale(0.95)
          card:
            color_thresholds:
              - color: '#039BE5'
                value: -50
              - color: '#0da035'
                value: 18
              - color: '#e0b400'
                value: 25
              - color: '#e45e65'
                value: 30
            entities:
              - sensor.lounge_room_temperature
            group: false
            hour24: true
            line_width: 3
            points_per_hour: 12
            show:
              icon: true
              labels: false
              name: true
              state: true
            type: 'custom:mini-graph-card'
        - type: 'custom:card-modder'
          style:
            border: solid 2px var(--primary-color)
            transform: scale(0.95)
          card:
            color_thresholds:
              - color: '#039BE5'
                value: -50
              - color: '#0da035'
                value: 18
              - color: '#e0b400'
                value: 25
              - color: '#e45e65'
                value: 30
            entities:
              - sensor.rumpus_room_temperature
            group: false
            hour24: true
            line_width: 3
            points_per_hour: 12
            show:
              icon: true
              labels: false
              name: true
              state: true
            type: 'custom:mini-graph-card'
      type: horizontal-stack
    - cards:
        - type: 'custom:card-modder'
          style:
            border: solid 2px var(--primary-color)
            transform: scale(0.95)
          card:
            color_thresholds:
              - color: '#039BE5'
                value: -50
              - color: '#0da035'
                value: 18
              - color: '#e0b400'
                value: 25
              - color: '#e45e65'
                value: 30
            entities:
              - sensor.bom_hobart_air_temp_c
            group: false
            hour24: true
            line_width: 1
            points_per_hour: 12
            show:
              icon: true
              labels: false
              name: true
              state: true
            type: 'custom:mini-graph-card'
      type: horizontal-stack
  title: Dehumidifier Information
Card background dissappears and there are just snippets of border at the top and bottom:
1 Like
capstan1
May 12, 2019, 6:01am
5
Looks greats, though!
tom_l
May 12, 2019, 6:42am
6
@tom_l Please could you post the YAML for your System Panel? I’ve been trying to recreate it without much sucsess
title: Graphs
icon: mdi:chart-line
path: graphs
panel: true
cards:
  - type: custom:vertical-stack-in-card
    cards:

      - type: custom:layout-card
        layout: vertical
        cards:

        - type: horizontal-stack
          cards:

            - type: 'custom:card-modder'
              report_size: 2
              style:
                border: solid 2px var(--primary-color)
                transform: scale(0.925)
            - type: 'custom:mini-graph-card'
              color_thresholds:
                - color: '#e45e65'
                  value: 0
                - color: '#e0b400'
                  value: 60
                - color: '#0da035'
                  value: 80
              entities:
                - sensor.speedtest_download
              group: false
              hour24: true
              line_width: 3
              lower_bound: 0
              name: Down
              points_per_hour: 4
              show:
                extrema: true
                icon: true
                labels: false
                name: true
                state: true

            - type: 'custom:mini-graph-card'
              color_thresholds:
                - color: '#e45e65'
                  value: 0
                - color: '#e0b400'
                  value: 60
                - color: '#0da035'
                  value: 80
              entities:
                - sensor.speedtest_upload
              group: false
              hour24: true
              line_width: 3
              lower_bound: 0
              name: Up
              points_per_hour: 4
              show:
                extrema: true
                icon: true
                labels: false
                name: true
                state: true

            - type: 'custom:mini-graph-card'
              color_thresholds:
                - color: '#e45e65'
                  value: 0
                - color: '#e0b400'
                  value: 60
                - color: '#0da035'
                  value: 80
              entities:
                - binary_sensor.google_dns_ping
              group: false
              hour24: true
              line_width: 3
              lower_bound: 0
              name: Up
              points_per_hour: 4
              show:
                extrema: true
                icon: true
                labels: false
                name: true
                state: true

#        - type: custom:vertical-stack-in-card
#          cards:
        - type: horizontal-stack
          cards:

            - type: 'custom:card-modder'
              recurse: false
              style:
                border: solid 2px var(--primary-color)
                transform: scale(0.925)
            - type: custom:mini-graph-card
              show:
                icon: false
                graph: "bar"
              name: Cpu use
              entities:
                - sensor.processor_use
              line_color: "#389638"
              color_thresholds:
                - value: 50
                  color: green
                - value: 70
                  color: orange
                - value: 80
                  color: red

        - type: horizontal-stack
          cards:

            - type: 'custom:card-modder'
              recurse: false
              style:
                border: solid 2px var(--primary-color)
                transform: scale(0.925)
            - type: custom:mini-graph-card
              name: Disk use
              show:
                icon: false
                graph: hide
              entities:
                - sensor.disk_use_percent_home
              line_color: "#389638"
            - type: 'custom:card-modder'
              recurse: false
              style:
                border: solid 2px var(--primary-color)
                transform: scale(0.925)

#        - type: custom:vertical-stack-in-card
#          cards:
        - type: horizontal-stack
          cards:

            - type: 'custom:card-modder'
              recurse: false
              style:
                border: solid 2px var(--primary-color)
                transform: scale(0.925)
            - type: custom:mini-graph-card
              name: Ram free
              show:
                icon: false
              entities:
                - sensor.memory_free
#                font_size: 50
              line_color: "#389638"

        - type: horizontal-stack
          cards:
            - type: 'custom:card-modder'
              recurse: false
              style:
                border: solid 2px var(--primary-color)
                transform: scale(0.925)
            - type: custom:mini-graph-card
              name: Ram use
              show:
                icon: false
              entities:
                - sensor.memory_use_percent
#                font_size: 50
              line_color: "#389638"


        - type: vertical-stack
          cards:
          - type: custom:vertical-stack-in-card
            cards:
              - type: 'custom:card-modder'
                recurse: false
                style:
                  border: solid 2px var(--primary-color)
                  transform: scale(0.925)
              - type: custom:mini-graph-card
                name: Temperatures
                show:
                    icon: false
                    extrema: true
                    fill: false
                entities:
                  - sensor.hall_temperature
                  - sensor.bathroom_temperature
                  - sensor.landing_temperature
                  - sensor.kitchen_temperature
                  - sensor.office_temperature
                  - sensor.bedroom_temperature
                line_color: "#389638"
Are you able to point out where I’m going wrong?
If you could post your config it would be a great help
tom_l
May 15, 2019, 1:09pm
8
I’ve changed it a bit today to make room for some more sensors:
But here’s my current System Monitor card (or did you want the config for the whole system view?):
cards:
  - cards:
      - card:
          color_thresholds:
            - color: '#0da035'
              value: -1
            - color: '#e0b400'
              value: 25
            - color: '#e45e65'
              value: 35
          entities:
            - sensor.processor_use
          group: false
          hour24: true
          line_width: 2
          points_per_hour: 60
          show:
            extrema: true
            icon: true
            labels: false
            name: true
            state: true
          type: 'custom:mini-graph-card'
        style:
          border: solid 2px var(--primary-color)
          transform: scale(0.95)
        type: 'custom:card-modder'
      - card:
          color_thresholds:
            - color: '#039BE5'
              value: -50
            - color: '#0da035'
              value: 40
            - color: '#e0b400'
              value: 50
            - color: '#e45e65'
              value: 60
          entities:
            - sensor.cpu_temperature
          group: false
          hour24: true
          line_width: 2
          points_per_hour: 60
          show:
            extrema: true
            icon: true
            labels: false
            name: true
            state: true
          type: 'custom:mini-graph-card'
        style:
          border: solid 2px var(--primary-color)
          transform: scale(0.95)
        type: 'custom:card-modder'
    type: horizontal-stack
  - cards:
      - card:
          color_thresholds:
            - color: '#0da035'
              value: -1
            - color: '#e0b400'
              value: 60
            - color: '#e45e65'
              value: 70
          entities:
            - sensor.memory_use_percent
          group: false
          hour24: true
          line_width: 2
          points_per_hour: 6
          show:
            icon: true
            labels: false
            name: true
            state: true
          type: 'custom:mini-graph-card'
        style:
          border: solid 2px var(--primary-color)
          transform: scale(0.95)
        type: 'custom:card-modder'
      - card:
          color_thresholds:
            - color: '#0da035'
              value: -1
            - color: '#e0b400'
              value: 60
            - color: '#e45e65'
              value: 70
          entities:
            - sensor.swap_use_percent
          group: false
          hour24: true
          line_width: 2
          points_per_hour: 6
          show:
            icon: true
            labels: false
            name: true
            state: true
          type: 'custom:mini-graph-card'
        style:
          border: solid 2px var(--primary-color)
          transform: scale(0.95)
        type: 'custom:card-modder'
    type: horizontal-stack
  - cards:
      - card:
          color_thresholds:
            - color: '#0da035'
              value: -1
            - color: '#e0b400'
              value: 60
            - color: '#e45e65'
              value: 70
          entities:
            - sensor.disk_use_percent
          group: false
          hour24: true
          line_width: 2
          points_per_hour: 6
          show:
            icon: true
            labels: false
            name: true
            state: true
          type: 'custom:mini-graph-card'
        style:
          border: solid 2px var(--primary-color)
          transform: scale(0.95)
        type: 'custom:card-modder'
      - card:
          color_thresholds:
            - color: '#0da035'
              value: -1
            - color: '#e0b400'
              value: 500
            - color: '#e45e65'
              value: 1000
          entities:
            - sensor.database_size
          group: false
          hour24: true
          line_width: 2
          points_per_hour: 6
          show:
            icon: true
            labels: false
            name: true
            state: true
          type: 'custom:mini-graph-card'
        style:
          border: solid 2px var(--primary-color)
          transform: scale(0.95)
        type: 'custom:card-modder'
    type: horizontal-stack
title: Sysem Monitor
type: 'custom:vertical-stack-in-card'
@tom_I Thanks for sharing, Are you using Yaml mode or are you using the built in editor?
Are you able to share the whole system view please?
tom_l
May 15, 2019, 1:43pm
10
I’m using storage mode but I edit in VSCode and paste into manual cards. I can copy the whole view using raw edit. It’s over 700 lines so I’ll use pastebin: https://pastebin.com/abDGcBqv
1 Like
@tom_l Perfect, I’ve dropped that into my config, I was attempting to split out my code into yaml mode, but I’ll go back to the built in editor.
I’ll make the edits to attempt to get this working this evening once I finish work
Thanks for your help
1 Like
@tom_l Work In progress…
Had to spend some time figuring out Netdata to capture all the stats, now I have more stats than I have time to create dashboards in hassio…
Thanks again for your assistance
1 Like
@tom_l What are you using for stats, as I am finding sending live stats to Hassio is using a lot of RAM often approaching 3GB in a single Chrome tab.
1 Like
tom_l
May 19, 2019, 12:53am
14
Just checked, Firefox uses about 700MB to initially load my system page. Chrome uses about half that. This will continue to climb while the page is open and more data comes in.
You can cut down usage by lowering the hours displayed or points per hour for each graph.
Also note that the latest version of the mini-graph card has some display issues.
opened 09:04PM - 17 May 19 UTC
closed 08:17PM - 21 May 19 UTC
Updated the mini-graph-card js to 0.4.1, and most of my graph cards disappeared. While investigating the problem I discovered only the...
bug
Hi @tom_l , I’m facing the exact same probelm with my config (Card background dissappears and there are just snippets of border at the top and bottom).
-> Have you found a solution to this problem ?
tom_l
June 13, 2019, 12:43pm
16
Unfortunately not. I’m still rocking borderless cards.
Thanks for your help. I think I’ve found something. It’s been a long time since I’ve dug into css so I can’t explain why, but display: block; is a potential solution.
It’s not pretty but hey, whatever works. Following example on the (messy) UI I’m working on:
Thos are two vertical-stacks-in-card , both in card-modders . First one has a 2px solid red border.
Relevant yaml:
  - type: custom:card-modder
     style:
      margin: 10px
      display: block
      border: 2px solid red
    card:
      type: custom:vertical-stack-in-card
      cards:
      - type: 'custom:card-modder'
        card:
          type: 'custom:text-divider-row'
          text: Salon
        style:
          font-size: 15px
          --secondary-text-color: '#CEE2F7'
Hope this will help someone !
*ps: if anyone can help me getting rid of the margins in my horizontal stacks that’d be sweet
tom_l
June 20, 2019, 6:09am
18
It might help if it was formatted correctly. As it is it’s impossible to tell.
You mean the yaml i posted ? I did not realized it wasn’t formatted properly, I’ll fix that.
Obviously there’s still a lot of work, and I want to make clear that the design’s not mine , I just found a nice picture on google images and tried to replicate it.
1 Like
tom_l
June 20, 2019, 7:56am
20
Thanks for fixing the yaml. Much easier to see what you are doing.
Unfortunately it does not work:


 *
*
