hi,
i have addend a forecast for my solar production in energy dashboard.
i tested SolarForecast and OpenMeteo and it work nice 
i still wonder how energy dashboard can create daily graphs with specific states per hour?
both forecast integration(s) seems to deliver only a energy kWh per “full day”, but not a forecast for each hour of the day?
notes: both screenshots are with OpenMeteo forecast. all the last days it fits more or less 100% my real solar production, only today i had a deviation…
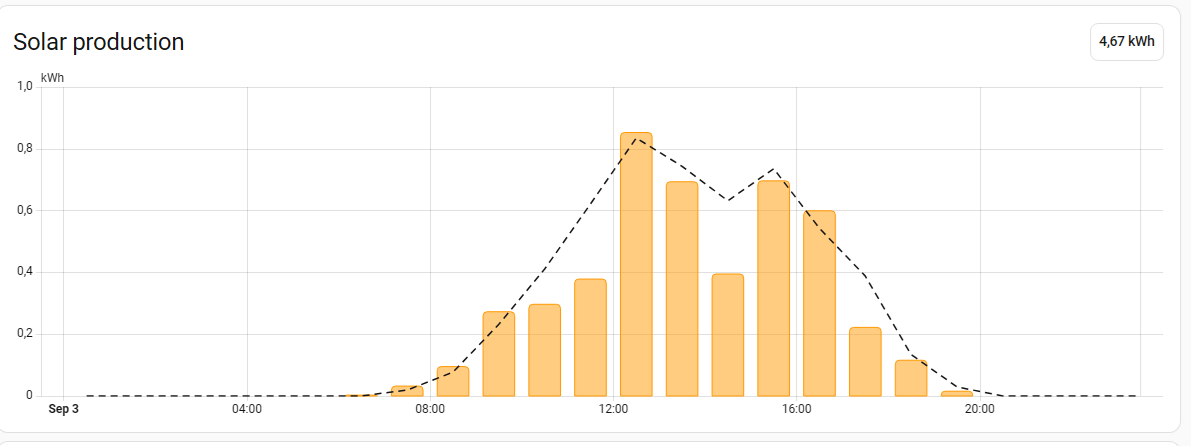
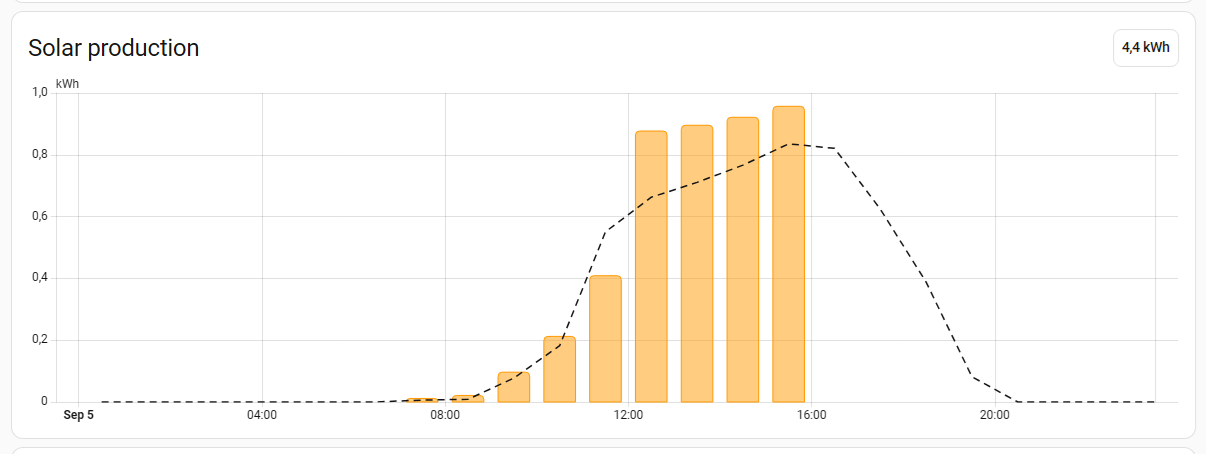
how it works? or is it an “estimation” of homeassistant energy dashboard?
br
Frank