As a “clean start”, I have installed HomeAssistant as a VirtualBox client. Then InfluxDB and finally Grafana.
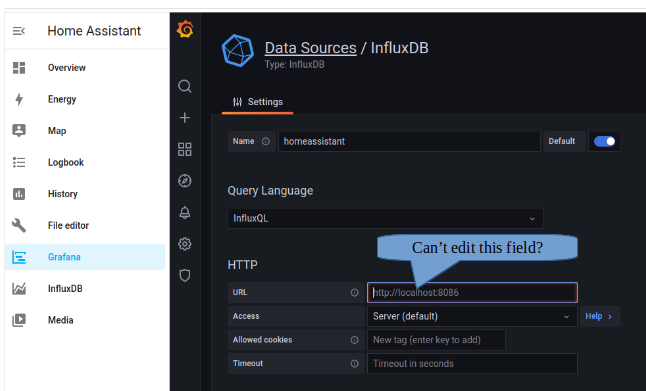
I think InfluxDB is reading/storing my ESPHome sensor correctly because I can use the InfluxDB “Explore” to view it. However, I seem to have trouble getting the Add Data Source to complete. When I select “Save & Test” it reports “Invalid URL”. I note from various tutorials that the URL may be “http://a0d7b954-influxdb:8086” but I can not edit the Garfana URL field?
I note somewhere, that only a Grafana Admin can create a Data Source. Is this a likely reason?
Seems likely. I have the same setup and only ever use the admin login, which can edit that field. I set it up ages ago though, so I can’t remember specifics. And yes, the URL is correct.
Hi Michael,
I have now learnt that the default user when using the Community Add-on is in fact “Admin” password “hassio”. And that was the active user when trying to create a Data Source. So I think user permissions are not likely to be the cause of my problem?
Sorry - which URL is correct? http://a0d7b954-influxdb:8086 or http://localhost:8066
Yes. Anything in particular you would like to draw my attention?
I am unable to change the URL from http://localhost:8086TOhttp://a0d7b954-influxdb:8086 as advised in that document.
Nothing! To add more detail…
If I make “Name” the focus, I get a Blue bounding box around the field and I am able to type, delete and relocate cursor within the field with the mouse.
However, if I click on the URL field, I get the blue bounding box. But I am not able to type or reposition the cursor with the mouse or the arrow keys?
When Grafana is first installed it appears to have as datasource “http://localhost:9090”
but it does not! It is an example and the text colour is slightly lighter than if you had typed it yourself.