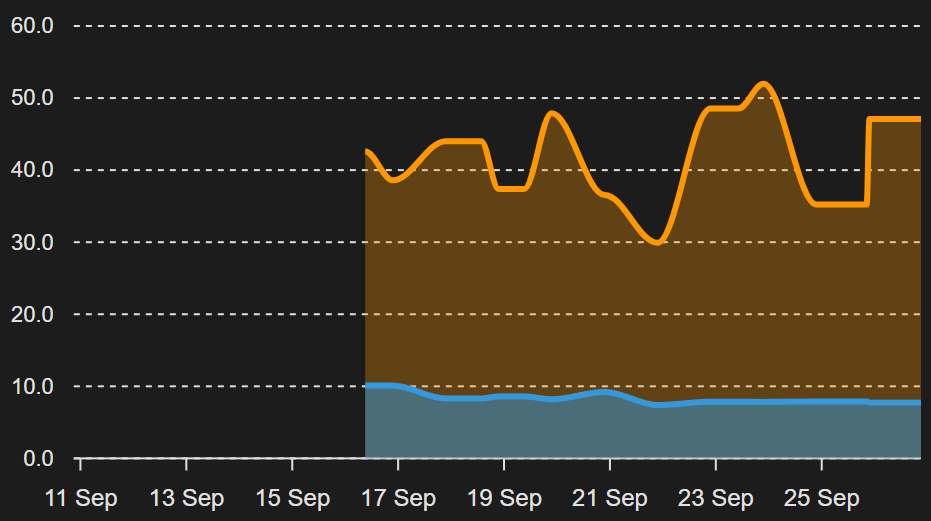
I’m showing a couple of LTS sensors’ data in an Apex Charts graph, but the graph seems to be only able to pull the regular 10-day History, not the long-term stats.
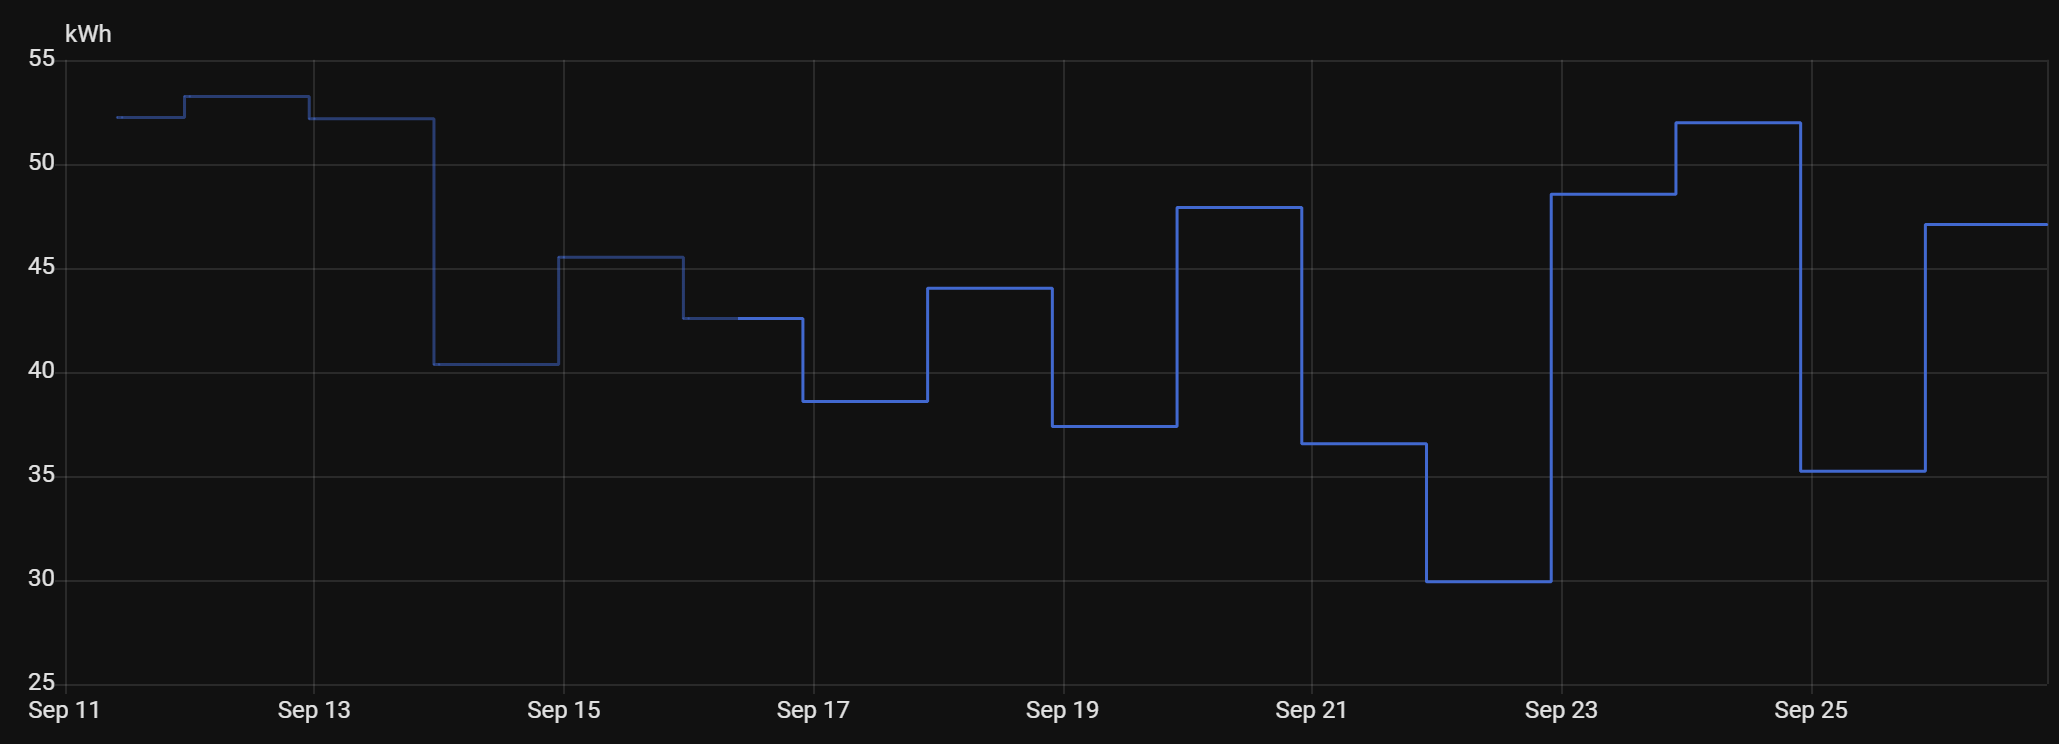
Here’s the sensor’s History display (darker blue line segment is LTS data:
Though I’m still not clear why an LTS sensors full range of data wouldn’t be available to anything querying it; shouldn’t the source of that data (LTS vs History) be invisible and provide the same results either way?
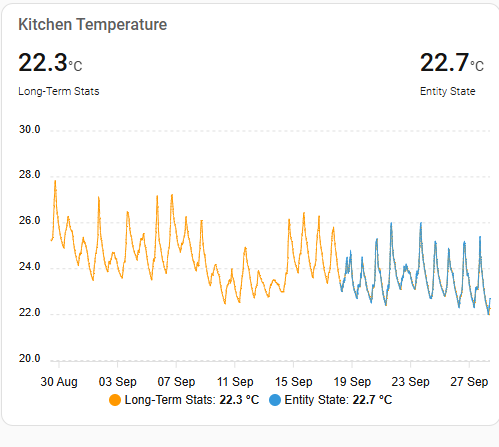
By default Apex Graph card pulls the entity state history, but you can plot any series from the Short-Term (5minutes) or Long-Term (>hour) statistics. Here I am plotting the same entity, using the state history (blue) and the long-term statistics as hourly mean (orange). By arranging to plot the LTS first, the state overplots, so the ‘state history’ shows and you can just see the difference.
Since the Long-Term stats are collated at the end of each hour (for the hour previous) there is always the LTS available, and since in many cases, particularly if you want to plot a long period, the visible difference is so minimal that just plotting the LTS should satisfy most people.