
Frustrating! yes, you need to see what your data history looks like for the data you are trying to plot. This is why first recommended you use a simple plot as I showed. With this you can click on the entity and see a plot of how much history you have and what it looks like. So for the temperature entity example I showed above, if you click on the entity you should be presented with a small graph of the history. As shown below. See if you can figure out your history, there are other ways to accomplish this. But the simple graph of an entity has been a good starting place for me. Also, find another entity in your system, for instance a temperature entity. Plug that sensor into your min max graph and see if plots. You have to know what your data looks like in the history database. If you are familiar with SQL databases, shutdown your HA system and make a copy of the history database somewhere you can experiment with the copy. By default, HA uses a SQLite database engine. You can find query tools to let you look into this database.

I also recommend to check the sensor data with this:
type: history-graph
entity: YOUR_SENSOR
hours_to_show: 12
refresh_interval: 60
Note: I wrote the code above manually and could make a typist mistake - please add this graph by using GUI.
If you get the graph - that means that the sensor is really changing and is recorded by Recorder.
Then we can proceed to the next step - try with mini-graph-card.
I want to create a graph with multiple entities and thus the range needs to go from -3000 to +5000. I have it working fine but want to add a marker line at 0 so it’s more obvious if an entity is above or below 0. How can I add the line? (I thought about graphing another entity with a 0 state but then it would also show in the legend which I don’t want)
Hi guys thanks for your help, but I think the problem lies in the “record” part and you see attached the status of the “db” is empty and there is also an error. What is strange that before when I went to the left bar in the “History” or “Register” part I would see everything populated with data, surely after some updates or by Hassio or the Home assistant something broke. For completeness, I also tried Ildar’s code to see the history if present and as an answer I had what I am attaching in the card. I think he needs to study the problem thoroughly.


How to add a “zero line”:

              - entity: sensor.zero_value
                name: ' '
                color: red
                unit: ''
                show_state: false
                show_indicator: false
                show_graph: true
                show_line: true
                show_fill: false
                show_points: false
                show_legend: false
                state_adaptive_color: false
                fixed_value: true
                aggregate_func: min
-
Do you have a historical data for your sensor in the History?
I did not understand whether you have it or do not.
Please attach a screenshot from the History with your sensor. -
You are not supposed to open db-file in the text editor.
-
If you think that the database is damaged - simply remove db-file and wait for some time to get historical data.
-
In my post I mentioned that I wrote the code manually and asked you to build the history0graph by using UI. So, there was an error in the code, here is the right code (specified “entity” instead of “entities” by mistake):
type: history-graph
entities:
  - sensor.cleargrass_1_co2
hours_to_show: 12
refresh_interval: 60

The goal of this test is to ensure that you have your sensor’s data in DB.
If the graph is shown - then go to the mini-graph-card.
Thanks for the info but unfortunately it didn’t work. I tried swapping to the default Lovelace theme in case that was the issue but it wasn’t.
entities:
  - entity: sensor.fronius_ac_power
  - entity: sensor.iotawatt_grid_total
  - entity: sensor.iotawatt_total_house_consumption
  - entity: sensor.zero_value
    name: ' '
    color: red
    unit: ''
    show_state: false
    show_indicator: false
    show_graph: true
    show_line: true
    show_fill: false
    show_points: false
    show_legend: false
    state_adaptive_color: false
    fixed_value: true
    aggregate_func: min
height: 500
hours_to_show: 24
lower_bound: -3000
name: Power Overview
show:
  labels: true
  state: true
type: 'custom:mini-graph-card'
upper_bound: 5000
Gives me this:

With no zero line…
Do you have this sensor?
Try simply this first:
type: history-graph
entities:
  - sensor.zero_sensor
hours_to_show: 12
refresh_interval: 60
hahaha. nope ![]() For some reason I was thinking it may have been an inbuilt function of the card… not enough coffee / not feeling the best this morning!
For some reason I was thinking it may have been an inbuilt function of the card… not enough coffee / not feeling the best this morning!
I’ll fix my stupid mistake and I’m sure it will work. I’ll create a template sensor or something with a zero value.
Thanks
EDIT:
I have working however if I try to use line_width: 1 to reduce the line size, nothing changes… How can I get the zero line to be much thinner than the others?
entities:
  - entity: sensor.fronius_ac_power
  - entity: sensor.iotawatt_grid_total
  - entity: sensor.iotawatt_total_house_consumption
  - entity: sensor.zero_value
    name: ' '
    color: red
    line_width: 1
    unit: ''
    show_state: false
    show_indicator: false
    show_graph: true
    show_line: true
    show_fill: false
    show_points: false
    show_legend: false
    state_adaptive_color: false
    fixed_value: true
    aggregate_func: min
height: 500
hours_to_show: 24
lower_bound: -3000
name: Power Overview
show:
  labels: true
  state: true
type: 'custom:mini-graph-card'
upper_bound: 5000

According to the docs, the line_width is a property for ALL lines.
Try this:
line_width = 1;
show_points: false - for zero line;
show_points: true - for other lines.
The idea is that a line with points seems to be thicker than a line without points.
That didn’t change anything. Thanks anyway, I’ll just leave it as-is.
Just wanted to say that this card is great, but no x-axis labels is a deal breaker. I will excitedly migrate my history graphs to mini graphs when/if this becomes available.
Is it possible to have:
tap_action:
  action: url
open in a new tab?
Hi thanks again for your patience then I put the new code back in an example and as you can see the chart row is flat and so I have no data in the history that can build a chart. Now it makes me think that the db is corrupt and this also makes me think the fact that I used to see the history now no longer. I wanted to take advantage of your suggestion to delete the “home-assistant_v2.db” file but I don’t know how to do it, can you tell me how to delete it ?. I read that it can be done and that when Home assistant restarts it creates a new one, is this true?
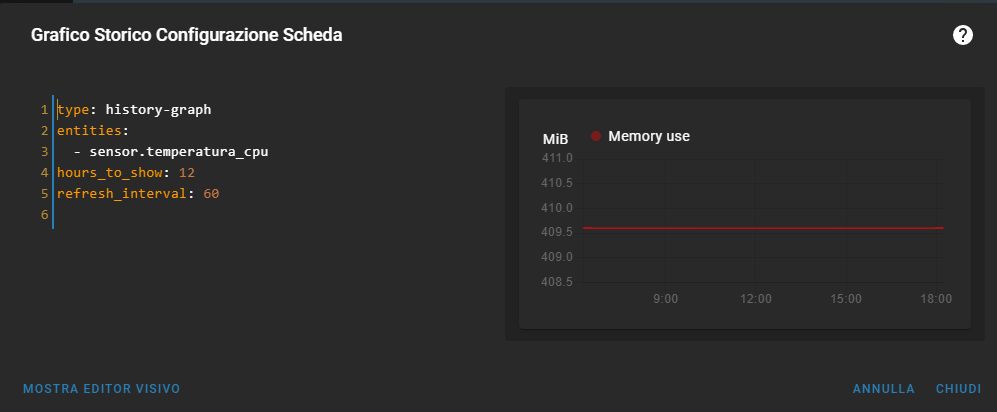
I may be wrong but in my opinion that means that you actually have data in DB - but these data are not changing, they are always = 409.5 or something. You should check how this sensor is created and assigned with values.
Of course, the DB may be broken - I am not an expert, I am also still learning.
To delete DB you must SSH to you HA, go to the “config” directory and locate the db-file:
ls -la
If this file is present - then remove it:
rm *.db
I am having HA installed in Docker. Just in case before this deletion, I stop the HA instance:
docker stop HA (or homeassistant, depends on how you named this docker container).
I stop the HA instance just in case, may be it is not needed, I do not know.
After db-file is removed, I restart HA:
docker start HA
Then HA creates a new fresh DB.
If you are having HA installed as Hass.io, then may be there is another way to stop HA.
Thanks I also think that the db is corrupt now I will do some tests and as soon as I have some results I will inform you anyway you have been of great help
Any way to combine graph bars and graph lines into one single graph (Real BARS not the workaround of zero to 1 values)
How can I leave the gas icon in white (not blue) and turn it red when below the set value:
type: 'custom:mini-graph-card'
entities:
  - entity: sensor.xxxxx_remaining_range_total
show:
  legend: false
color_thresholds:
  - value: 140
    color: '#3498DB'
  - value: 50
    color: red
name: X2
line_width: 6
font_size: 75
animate: true
lower_bound: 0
upper_bound: 850
hours_to_show: 360
points_per_hour: 0.1
icon: 'mdi:gas-station'
