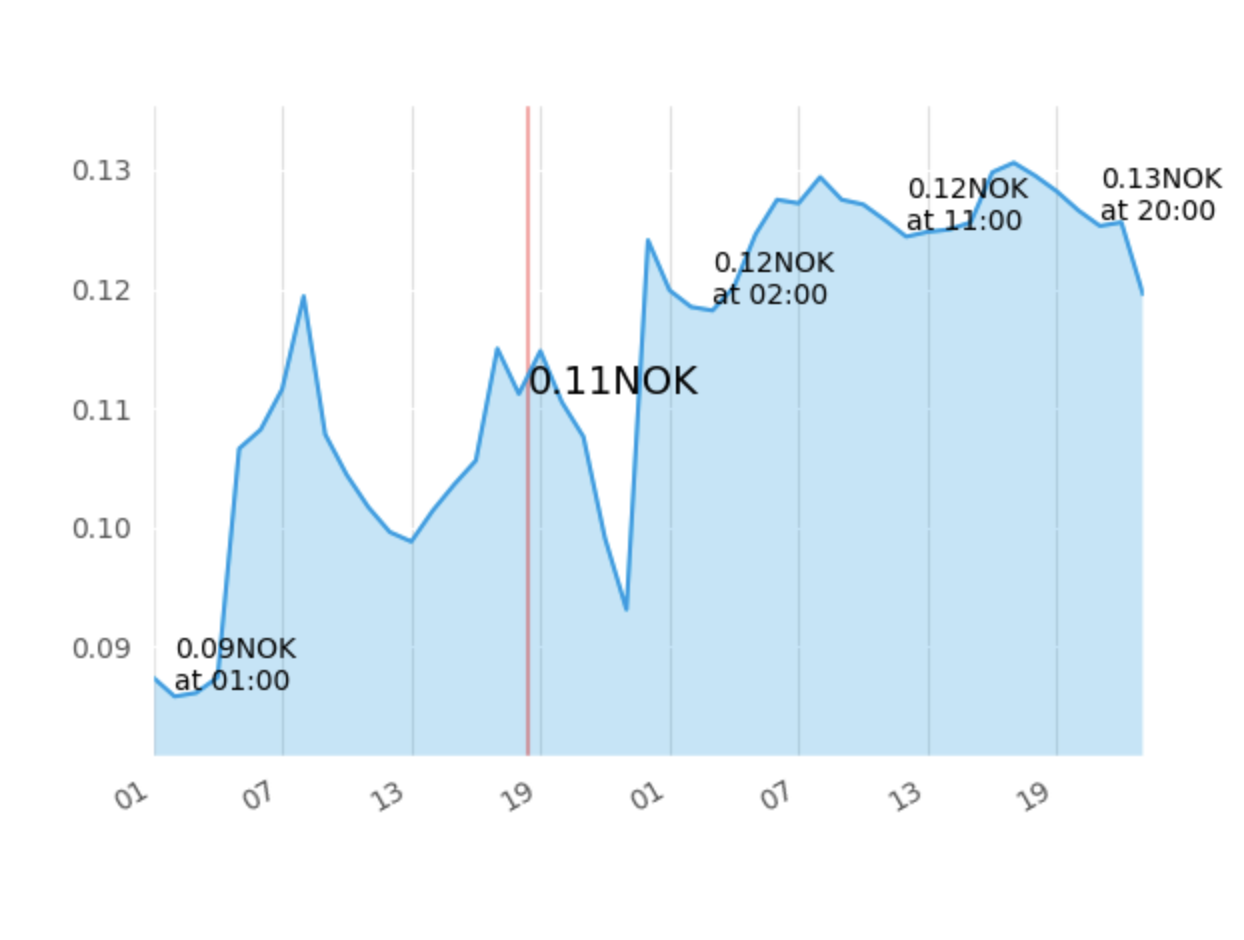
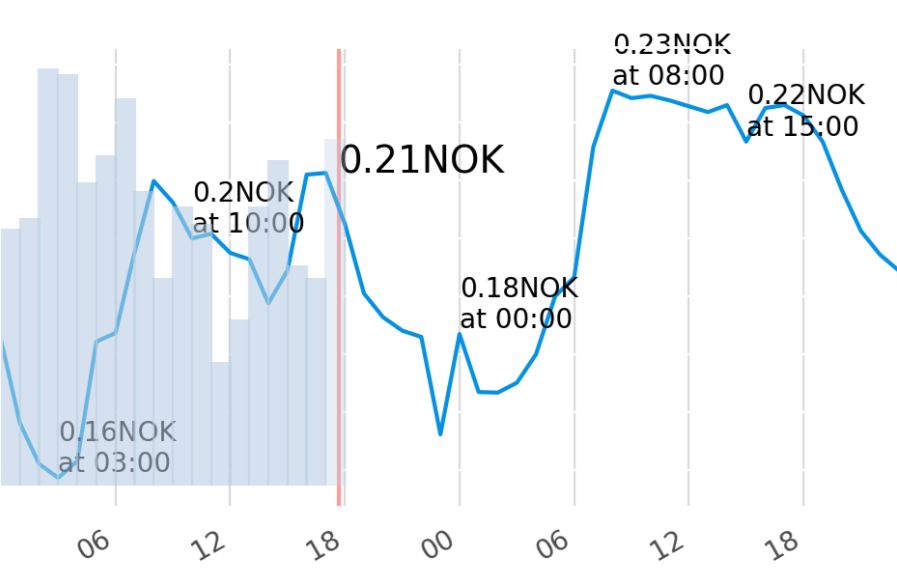
I am also working on visualizing the consumption data.
Tibber is available in Germany, Norway and Sweden Tibber has helped tens of thousands of new customers each month in Sweden, Norway & Germany to lower their energy bill and consumption. Tibber is using digital technology to make electricity consumption smarter.
If you use this link to signup for Tibber, you get 50 euro to buy smart home products in the Tibber store: https://invite.tibber.com/6fd7a447
Looks very interesting, will it show tomorrows price as well (from noon when they are available)? I mean is the red line current time or just a marker?
I’m not able to add it as custom repository in HACS: “Repostitory structure for 0.1 is not compliant” - am I doing something wrong?
Never mind, I used the wrong category in HACS.
Thanks for the answer! I created an enhancement request in the repo for support of an external energy meter. I guess it’s a bit of a corner case so close the request if you feel that it is out of line.
I’m trying to figure out how to go from using fixed start and stop times at night to turn on my water heater to dynamic times based on price forcast. Have you considered adding some functionality to utilize the forcast information? What I have in mind is a sensor that offers me to set it up such that I get a configurable window in time (number of hours) that is cheapest every day.
All future prices are available from hass.data["tibber"]
I use that data for my price optimizations. You can see how the custom component gets the prices.
I take it you’re gently pushing me in the direction of write your own integration. Maybe I’m ready for that soon. Was hoping that you would latch on the idea.
Following the past 3 month of prices,you cant really tell/predict what time of the day the price is “low”, sure night-time usually gets lower, but it’s not because it’s “night” , so instead you could use the “simple” way, with your current sensor ( " if price = or less than “” ) , or “include” 2 point of measuring, so the automation knows whether the price are on the way down, or up … in other words, start your heather when price drops below certain criteria, stop the heather when they are no longer “valid” … this way you wont miss the cheap prices during day time ( as we have had quite a few of lately, here … below 0.20 kr )
But dont forget to make an additional automation (Water Temperature), " if water-temperature in the heather is below X, ignore automation (Cheap_Price), and start the heather (other vice you might get a brutal morning shower )
Anyone else who has problems with the visualization? It has been working for a long time but suddenly two days ago I dont get a graph. In the logs it says tibber time out when setting up. The Tibber integration is working fine. Just the camera from tibber custom that doesn’t load.