Hi there. I’m a beginner of HA. I have serval questions about the dashboard to consult you guys. Thanks in advance.
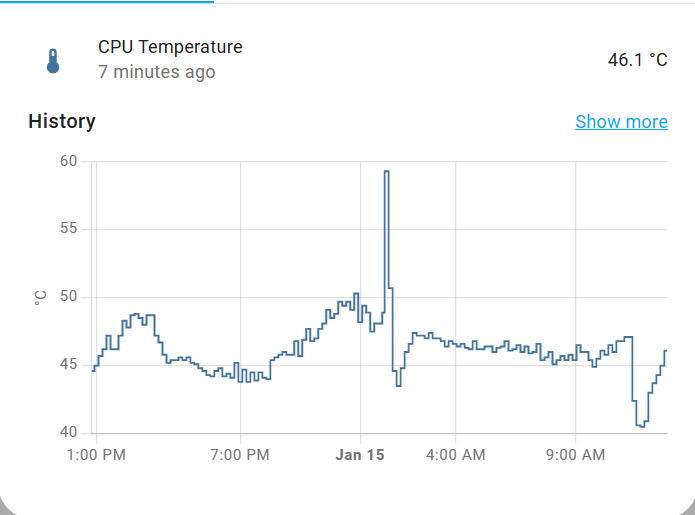
I added some sensors from the configuration file and configured it as “command line”. But I don’t understand why the widget of some sensors cannot display the history value continually, which means there is always some interrupt area in the line chart. Please check the image.
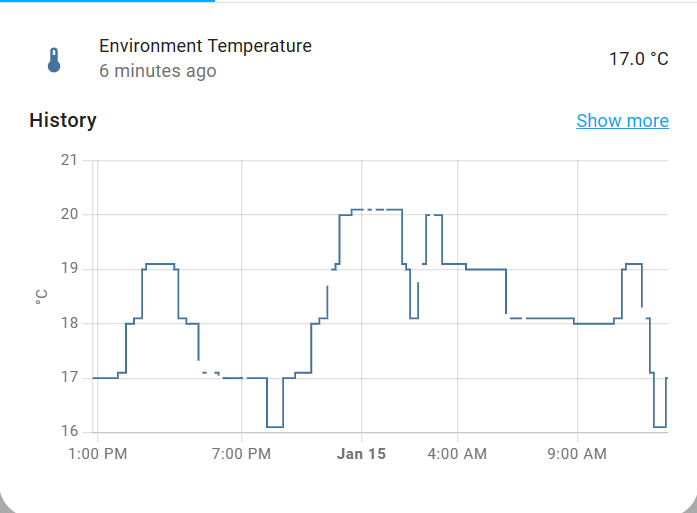
However, another sensor that uses almost the same configuration doesn’t have same problem. I can’t upload images since I’m a new user, but I will show you in reply.
This is my configuration of these two sensors:
platform: command_line
    name: CPU Temperature
      #    entity: 'CPU'
    command: "cat /sys/class/thermal/thermal_zone0/temp"
    unit_of_measurement: "°C"
    value_template: '{{ value | multiply(0.001) | round(1) }}'
    scan_interval: 600

  - platform: command_line
    name: Environment Temperature
      #entity: 'temp'
    command: "cat /config/custom_components/dht/env_temp"
    unit_of_measurement: "°C"
    value_template: '{{ value_json.temp | round(1 )}}'
    scan_interval: 600
Can someone tell me how to fix it? How can I make the line be constant?