Aeotec DSB09104 Home Energy Meter (HEM) gen1 parameters

Correct, it’s shows as USB but it’s actually powered by a 5v wall wart. No batteries installed.

Right, but I’m not sure how to get that again. I had turned debugging logging on at the start of today’s trial. From where do I download it?

This may all be clearer from the log, but in case it isn’t I had already written it. Maybe it will be useful for someone else.

When I added the meter to HA, and went into its configuration, the switch was off:

Sensors had readings, but did not change through this entire saga:

I went into “entities not shown,” and found:

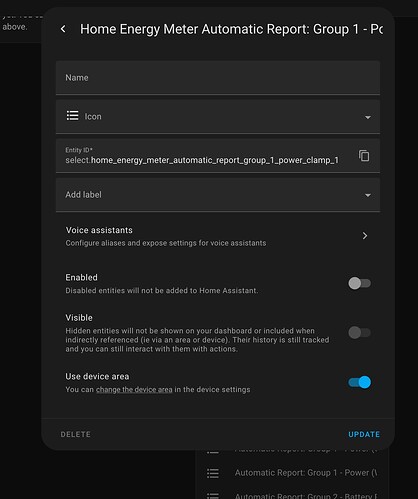
Which appears to correspond to the parameter I show in the config page above. I enabled it, as well as the other three Automatic Report entities for power: Group 1, Group 2, Group 3, and Whole HEM). I think that 1 and 2 refer to the two sensors I have. If I have whole or 1+2, that would be good.

Each responded with, “The enabled entities will be added to Home Assistant in 30 seconds,” but all still showed as disabled after several minutes. Reloading the page did not change them:

The sensor values remained unchanged from the initial inclusion.

Next, I tried to enable all 4 using the popup menus. Group 3 could not be enabled, which makes perfect sense as I only have 2 sensors. I waited a couple of minutes and reloaded the page. No change.

I went into Configure under Device info, and the switches were on, corresponding with the changes I made:

Finally, I went to my dashboard. Choosing any of the three entities only put “Enable” in place of the power reading.

How does this 5v wall wart work? The device thinks it’s on battery.

No, it’s not the same. The one you changed in ST is Whole HEM. This one is Clamp 1.

Each responded with, “The enabled entities will be added to Home Assistant in 30 seconds,” but all still showed as disabled after several minutes. Reloading the page did not change them:

That is referring to enabling the entities, it doesn’t have anything to do with what their values are. You don’t need the entities unless you are automating them. After you enable the entities you would still need to change the value.

Got me! It just connects to the third of the three ports. The bigger mystery is how I would connect it to a PC to update, but according to Aeotec, there’s no reason for it in my application.

You plug the HEM’s USB port into a USB port on a Windows PC and run their update program. But their firmware page doesn’t even have a changelog, so who knows what’s changed?

If you want the device to behave like a powered device, I think you need to include it on USB power. Right now it’s acting like a battery device and doesn’t listen for config changes until woken up. Or I could be mistaken and it’s always a non-listening device but wakes up every 1 second, which would be weird and would certainly bring a Z-Wave network to its knees (would need log to see it).

My post directly above that has instructions.

Sorry, that was unclear. I switched both on in HA, as you can see from the later screenshot.

Those changes remain, but sensor readings remain the same as they were when first added.

Yes, but there is no USB port on the outside or under the snap-off cover. Maybe there is if I remove the inner cover, but I don’t need to update.

It reports every 60 seconds on ST. It shows as USB powered (read-only) in HA:

Does it show as something different elsewhere?

Sorry for my slowness here.

So do you want the JSON file resulting from the Download diagnostics button? It looks like a config file, not a log file.

Or do you want the home-assistant.log file?

Is it worth putting in batteries and turning on Parameter 12 above?

Are you referring to this one?

These are not the same settings as you had in ST.

ST:

This screenshot:

I mean, I guess I’d still expect power entities to update, but you don’t have any energy reporting enabled (kWh) so those won’t change.

Are you trying to measure, power, energy, both?

Yes, but there is no USB port on the outside or under the snap-off cover. Maybe there is if I remove the inner cover, but I don’t need to update.

I guess Aeotec would have to answer to that, I was just going by the manual. The device does not report OTA firmware update support, so it can’t be done through ZJS.

It reports every 60 seconds on ST. It shows as USB powered (read-only) in HA:

Apparently the device realizes it’s on “USB” power, but I’m not sure Z-Wave JS agrees because it reports:

      "isListening": false,

Still, somehow you were able to change the settings anyways, so I’m not sure if this matters then.

I’m asking for the driver log file. Difference in tilt sensor performance between ST and HA - #2 by freshcoast

Yes. I was trying to cast a wide net, as Groups 1 and 2 appear to correspond to the legs in the panel.

I’m fine with power only. Turning on all of those for Group 1 didn’t change anything that I could see.

Still, it’s progressed from requiring a button press for listening to taking changes without one.

I’m trying to comply. From that page:

Set the log level for zwave_js_server to debug. This can either be done in your configuration.yaml in the logger section, or using the logger.set_level action. When the integration detects that the log level has been set to debug, it will also set the Z-Wave JS logs to debug if the level isn’t already verbose, debug, or silly and will include those logs in the Home Assistant logs. The Z-Wave JS logs can be found under the logger name zwave_js_server.server.

Apologies, but I don’t understand that last sentence. I see 435 entries with “zwave_js_server” in home-assistant.log, which drove my question. Is “logger name” a heading in that file, or does it refer to a separate log file, possibly in a different directory?

Or should I turn on the logging window, then exclude and include again?

Those are the logs from HA (#1). Logger name is the component name that is logged.

Except you posted an actual driver log from a different file in Difference in tilt sensor performance between ST and HA - #3 by Jz777, unfortunately I can’t tell you how you did it, only provide the methods to get them. I suspect you are using ZUI and opened the driver log file (option 2), but I don’t recall you providing which addon you are using. So maybe look there if so, easier than HA logs.

No, not UI.

I could do it again to get more specific ones from the window at /config/zwave_js/logs, but in the meantime I’ll just post the whole home-assistant.log in parts. Let me know which is easier for you.

Ok, then did you enable log_to_file in the addon? In that case, the log is at /addon_configs/core_zwave_js. The raw driver logs are much easier to read than the HA logs, but the HA logs also include the messages sent to the websocket server, which is sometimes useful.

part 1

part 2

part 3

part 4

This might be helpful, from the window in the last few minutes. As I knew I’d be logging, I didn’t change the interval to 60 sec.

Ok, well it will take a little time to look at those. FYI, it looks like you’re actually using the logging window right? It will stop listening unless you have HA configured not to close the UI websocket connection. The file options avoid this problem and so you don’t have to keep the window open.

I guess I didn’t, because the only thing in that directory is a cache directory, with no names that look like logs.

Again, if it is easier for you, I can start over.

I only figured that out in the last hour. :slight_smile:

Good to know, thanks.

I wrote my thesis in 1986 in vi on a VAX running UNIX, then my UNIX since then has been limited to MacOSX troubleshooting as the entire IT department for a 35-person research institute, so finding a lot of this takes time.

My deepest recent achievement was a triple-booting Mac/Win/linux Hackintosh. At least my son was impressed.

Really, I’m just fine repeating this tomorrow, as I’ve already learned a lot today that I think would greatly reduce your time spent. Thanks!

1 Like

No worries. I’d suggest enabling that log to file option just to make the collection a little easier, and you can grab it at anytime.

Thanks. Just for reference, it took me multiple searches to figure out how to turn on log_to_file in (edited as per posts below):
…/hassio/addon/core_zwave_js/config

For the good news…
I looked at the log at /config/zwave_js/logs last night, the one you advised me not to do, and saw events like this for kWh and power (power shown):

2024-11-23T15:42:56.880Z SERIAL « 0x010e0004001508310504640006c93a49                                  (16 bytes)
2024-11-23T15:42:56.883Z SERIAL » [ACK]                                                                   (0x06)
2024-11-23T15:42:56.886Z CNTRLR   [Node 021] [Multilevel Sensor] Power: metadata updated            [Endpoint 0]
2024-11-23T15:42:56.888Z CNTRLR   [Node 021] [~] [Multilevel Sensor] Power: 443.96 => 444.73        [Endpoint 0]
2024-11-23T15:42:56.890Z DRIVER « [Node 021] [REQ] [ApplicationCommand]
                                  └─[MultilevelSensorCCReport]
                                      sensor type: Power
                                      scale:       Watt
                                      value:       444.73

The default entities were still not updating from the original inclusion. I looked for an entity called “MultilevelSensorCCReport” to put on my dashboard, but could not find one. There were kWh and other power updates too in the log that I didn’t need, so I went into the config.

I left Parameter 111 (Report Interval (Group 1)) at 60 sec.
I turned off all switches except Parameter 101, Bitmask 2 (Automatic Report: Group 1 - MultiSensor Wattage (Whole HEM)), since the log mentioned “MultiSensor.”

The kWh log entries stopped and the power continued. I think–but do not clearly remember if I checked–that the default entities shown remained unchanged last night.

This morning, I had the idea that something might have been added to the Overview dashboard, since something was reporting. Nothing had been added, but now the default entities were updating every minute!

So the one thing I wanted is working as desired. I suspect the same would be true for usage in kWh. I don’t know whether the Parameter 101, Bitmask 2 switch being on has anything to do with it, but at this point I’m afraid to experiment and lose it. I’m not sure whether Parameter 1 should be 120 or 240 v; nor whether I should be using Power, Power (1), or Power (2), but I can use a known load to figure that out.

TL;DR–turn on the switches for desired MultiSensor parameters and wait.

Just posting this for someone else; not sure if this post should be checked as the solution. Thanks for all your help.

1 Like