Automation time not working correctly

ok, I will add an id and as a new automation as you described above.
HA Core etc.

  "home_assistant": {
    "installation_type": "Home Assistant OS",
    "version": "2023.1.7",
    "dev": false,
    "hassio": true,
    "virtualenv": false,
    "python_version": "3.10.7",
    "docker": true,
    "arch": "x86_64",
    "timezone": "GB",
    "os_name": "Linux",
    "os_version": "5.15.90",
    "supervisor": "2023.01.1",
    "host_os": "Home Assistant OS 9.5",
    "docker_version": "20.10.22",
    "chassis": "vm",
    "run_as_root": true
  },

ID added in yaml, saved reopened and it disappeared. Thinking the yaml editor does not show it, I
looked at automations.yaml, and there it is! Also, there is already an ID in every automation script in my automations.yaml. So, I removed the ID I put in to avoid two ID’s.
Therefore the ID exists for every animation, but you can only see it in automations.yaml.

created a test-relay in esphome
created an automation note the ‘generated’ ID

- id: '1675178054773'
  alias: relay-test-on
  description: relay-test-on
  trigger:
  - platform: time
    at: '15:38:00'
  condition: []
  action:
  - event: TEST
    event_data: {}
  mode: single

This worked at 15:38:24. Brilliant
I will now change the event to switch on test-relay, and report back

test-relay working on and off within 10 seconds of the trigger timer.
I added my lamp (the shelly 2 device), it turned on after 38 seconds, ok but it turned off 3 1/2 minutes late. Far better than the random 12 -15 hours of the existing lights_off automation.
I cannot see any difference between the lights-off and my new test-relay off automation.

I had a helper (as advised in a post) “to switch as X” I deleted that, and the of time is now within a minute. It is more than likely the polling time of the shelly 2 device.

conclusion :- there was something wrong with the lights-off automation that was further complicated by the delay/no response of the shelly 2 device. I do not know it HA waits for a ping back from the shelly device or not.
I will in future look at the automations.yaml to check any mistakes.

Anyway, its working now and I can order two more shelly 2 devices to replace my ancient X10 devices.
I will try to resolve the timing delays of the shelly 2 device in a new post.
Many thanks to everyone who has contributed to this post to help me learn more about HA.

Still, it shouldn’t be minutes. Milliseconds, sure, seconds even, maybe, but not minutes and surely not hours ever.

It sounds to me like you have a misbehaving integration. Do you have any custom integrations installed?

Yes I agree. Two custom integration, security spy (now removed) and hacs. It did not turn off the light at 10:15 last night.
I have deleted all the automations, checked the automations.yaml that contained only [] and restarted HA.
I added 1 automation that creates a message on my iphone when the garage door is opened.
This works perfectly. (not using time). So there is no time lag with HA running in a VM.
created test-relay-on and test-relay-off
trigger time test-relay-on 11:00 time executed 11:00:06 good
trigger time test-relay-off 11:02 time executed 11:03:28 not good

better but as you said above not correct

I did discover one thing new about how time triggers work. Starting in 2022.12, there is a random offset of between 50 and 500 msec added to each time trigger (and some other things in the system that are scheduled to run at a particular second.) This means, e.g., if you have a time trigger at “09:00:00”, it will try to run at anywhere from “09:00:00.050” and “09:00:00.500”. Normally this isn’t an issue. It was done to prevent many, many time-based events, all scheduled at the same time (particularly, at a time whose microseconds component is zero), from all trying to run at exactly the same time. See Fix high latency from thundering heard at 0 microseconds by bdraco · Pull Request #82233 · home-assistant/core (github.com).

I should also mention that offset is calculated once per time-based event. I.e., for a particular time trigger, it will get a random offset that stays the same for that trigger. A different trigger will get a different offset, that then stays the same for that particular trigger, etc. To put that another way, each time trigger will have a different offset, but for each trigger its offset won’t be changing.

But this still doesn’t explain what you’ve been experiencing.

I’ve been refreshing my memory on how time-based things work in HA. The bottom line seems to be that there is a monotonic clock used for scheduling time-based events. When an event needs to be scheduled, the current time (i.e., time.time()) is subtracted from the desired time (typically from something roughly like now().timestamp()), to get a time delta (in seconds.) Then a “callback” is placed to run that (delta) amount of time in the future, based on the monotonic clock.

So, what does that all mean?

First, time.time(), now().timestamp(), etc. are based on the underlying OS’s time. If that time gets adjusted (NTP, etc.) between the time the event is scheduled (and for a fixed time trigger, that is basically once per day), and when it runs, that could, at least partially, explain the difference you’re seeing.

The other thing is, if the monotonic clock (which is not supposed to change when the underlying clock is adjusted, that’s the whole point of a “monotonic” clock) that is used for actually scheduling the events is drifting, that could also, at least partially, explain the differences.

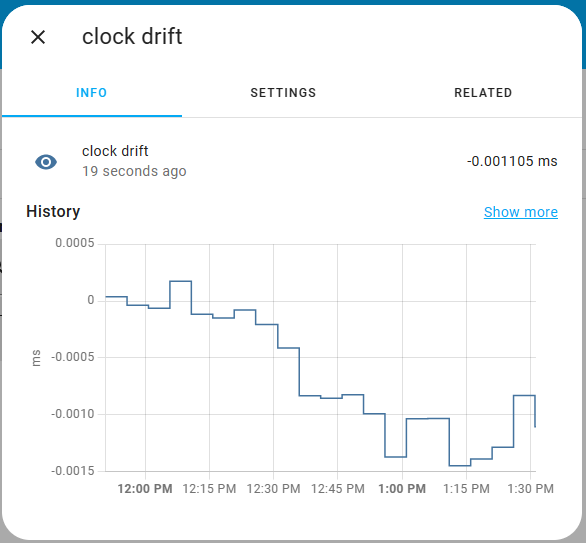
I’m running some experiments on my own system. I already have a relatively simple custom integration I wrote that does something every five minutes. I added code to it to check the difference between time.time() and the monotonic clock when it starts, and then every five minutes. If the underlying clock isn’t adjusted, and everything is working perfectly (which, of course, they never are), in theory the difference between time.time() and the monotonic clock should not change. Any change in that difference would be drift of one, if not both, of the clocks.

I’ve run it for a bit, and so far, it looks like on my system the drift is around 1 µsec / 5 minutes. That would mean the drift would be around 300 µsec or less per day.

EDIT: Sorry, that’s wrong. I initially misinterpreted the results. The difference is actually staying about the same, so for the short time I’ve run it, I do not see any drift.

If you’d like to try it, I can certainly whip up a custom integration that does just this. Right now, it’s just logging to home-assistant.log, but it would be easy for it to create a sensor that could be displayed in a history window. Let me know if you’re interested.

In the meantime, it would be interesting to know something more about your system. You said, “its a virtual machine running on virtualbox in a Macmini.” What do you have for acceleration under the VM’s system settings? Does the VBox UI, when HA is running, show that virtualization acceleration is enabled in the tray in the bottom right? Is virtualization acceleration (e.g., VT-x, etc.) enabled in the “system BIOS” (or whatever is the equivalent on a Macmini)?

Also, here is a potential, at least temporary, workaround…

Instead of using:

trigger:
  - platform: time
    at: "09:00:00"

Try this:

trigger:
  - platform: template
    value_template: "{{ now() > today_at("09:00:00") }}"

Note that a template trigger will “fire” when it evaluates as true after having evaluated as false. That means, if HA starts when it is already after the specified time, the template will evaluate as true. This will not cause it to fire (because it didn’t change from false to true.) It will have to evaluate as false (when it gets to midnight), and then evaluate as true (when it gets to specified time), for it to fire. Then, this repeats, meaning it will only fire once a day when it crosses from before the time to after the time. Note that the template will be re-evaluated at the beginning of every minute.

Just like a time trigger, it’s also possible to use the template trigger to compare the time against an input_datetime helper, if you should need that, too.

@chrisfairbrother did any of that help?

Sorry Phil, I was not allowed to ‘play’ yesterday.
Many thanks for your detailed explanation of the time function, very interesting. I will try your value_template and look at the VM today.
Chris

1 Like

I tried your value_template
automation time 10:00:00 trace 10:03:30
much better, but not as quick as it should be.

I have created a new HA on an old intel pc using a generic X86-84.
added my shelly 2 lamp and one automation
automation time 11:00:00 trace 11:00:00
no delay at all. This proves there is nothing wrong (delay) with the shelly 2 device.
It does boot very quickly compared to my old mac mini.
I am now suspecting the mac mini is underpowered?

I built a new VM for HA.
added my shelly 2 lamp and one automation
automation time 12:00:00 trace 12:02:15 using value_template
Looked at the paravirtualization on the VM. This was set to Default. for Linux guests, it is recommended to use KVM. Now changed, but still about 2 minutes delay.

On my existing VM
changed the paravirtualization to KVM
automation time 16:05:00 trace 16:05:20 using value_template; much better.

The cpu load and memory usage graphs on the mac mini show about 15% cpu and 20% memory usage.
So its not working very hard, even when the automation is triggered.
The memory usage of the HA (settings->system:>hardware) show
Screenshot 2023-02-03 at 16.05.22
Screenshot 2023-02-03 at 16.05.31
still nothing looks like a problem.

I will test again tonight at sunset and 22:15 and report back.

That is my suspicion as well. And the VM seems to be making it worse, especially when not using some hardware-based virtualization acceleration. (Besides KVM itself, there’s also the enabling of the hardware-based acceleration. On an x86 PC, that’s done in the BIOS. Not sure for a mac or macmini.)

As I mentioned earlier, for the template trigger that uses the now() function, it gets re-evaluated every minute. But it’s important to note that exactly when that happens (and, hence, when it might possibly “fire”) is based on the monotonic clock, not the real-time clock. So, it is, at least somewhat, affected by the same theoretical problem. Also, there are probably a lot of things in the system that are being run every minute, as well, so they can kind of “stack up”, further delaying the template trigger, and possibly making it jitter over time. Still, the reason I suggested it is, if there is some sort of drift going on, I would think the affect would be less for something scheduled every minute (which compares against the real-time clock) as opposed to something that is scheduled far into the future (like once a day.)

Regarding the “clock drift” custom component I alluded to earlier, I think I have it in a form that you (or anyone) could try. I made some changes to how it works, so I had to purge the history I had collected, but for the short time I’ve been running the latest version on my system it looks like this:

The scale is msec, so the drift so far is within +/- 1.5 µsec. Since I started this experiment, I think I’ve seen it within +/- 2 µsec. The interesting thing is to see if it stays pretty much constant (within a small range) or continues to mostly slope up or down. So far, I’ve only seen it stay pretty much constant, no long-term drift.

If you know how to add a custom repository via HACS, it should be pretty easy for you to give it a try on your system(s). It could help prove or disprove the theory I’ve suggested. :sweat_smile:

1 Like

Do you have a link to your clock drift integration Phil?

I’d like to try it.

Yep, here it is:

I haven’t created any official releases yet, just the one commit so far.

@chrisfairbrother I’ve been trying to think what could account for minutes, or hours, of delay like you said you’ve seen. Honestly, it’s really hard to imagine.

There are three four things I can think of that can cause a time trigger to be delayed (as opposed to completely missed, some of which we’ve already discussed):

  1. The event loop’s time reference (which, AFAIK, is basically time.monotonic()) running too slowly.
  2. The hardware (and/or the VM) is just way too underpowered to run the system, or is feeding bad clocks to the system.
  3. Some asyncio code running in your system that is not behaving correctly. (Basically, asyncio is a cooperative multi-tasking system, and if a task runs too long before await'ing something (e.g., it calls a callback that runs too long), then it can prevent the event loop from properly running things at the correct time.)

EDIT:

  1. The underlying OS’s clock changing, e.g., being adjusted by NTP. Normally, though, NTP is supposed to adjust the clock slowly if it’s off, and then tweak it from time to time to keep it accurate. It’s not normally supposed to jump a significant amount. And, BTW, DST changing shouldn’t cause this. Yes, the time will jump an hour at a DST switch, but I’ve seen recent changes in HA’s code base to try to handle this better. Even so, that’s only twice a year, not every day.

My clock drift custom integration is an attempt to see if #1 is happening.

Regarding #3, it’s possible to run HA in a debug mode, which will enable debug in asyncio. This should generate warnings if any piece of code is misbehaving (basically taking more than 0.1 seconds between task switch points.) If you can run HA from the command line, then: hass --debug. If not, you can also enable asyncio debug by setting the environment variable PYTHONDEVMODE to a non-empty string. I’m not sure which can work for you since you’re using the HA OS.

In any case, I’m really struggling to understand how you could be experiencing minutes of delay for a time trigger, even considering all of those potential causes.

1 Like

lights on at sunset and lights off at 10:15 - nothing not even hours later. and my notification of my garage door is open is not working now!

mac mini virtualization acceleration
“Basically, you need to ensure your software is updated to latest version . VT-x is enabled by default, but there’s no “setting” or command that can be issued to turn it on.”

debugging:- the only way I found to turn on the debugging was:-
on the command line
su options --debug=true
su reload

I assume extra logs will be added to home-assistant.log?

I tried the garage door open automation this morning,
2023-02-05 11:39:05.043 ERROR (MainThread) [homeassistant.components.mobile_app.notify] Requested entity was not found. This message is generated externally to Home Assistant.

I will test your drift sensor

I suppose my existing HA could have a problem? It seems to be getting worse.
I will be the first to admit my Mac-mini is slow. I don’t get the coloured wheel (waiting to do something)
It only uses 15 watts, is silent and all my temperature gauges in HA work fine. It only has problems with automations.

I will work on the new HA VM I built the other day, Using only 3 automations and see what happens.

Stooped my existing HA
working on the new installation of HA as a VM. Trying to prove its a timing error and not something in my existing HA
added only :-
my test_relay, shelly 2 lamp, garage door sensor, terminal+ssh, hacs and your clock_drift (many thanks)
and 3 automations
garage door sensor → message to iphone is spot on
test relay on and off within a few milliseconds.
Looking good
added

clock_drift:
logger:
to configuration.yaml, restart.

started testing at 17:13 by 17:51 the clock drift is over a second.
sampling at about 10 minutes although your script = “INTERVAL = timedelta(minutes=5)”?

test_relay on at 17:40 trace Executed: 5 February 2023 at 17:42:52 nearly 3 minutes
test_relay off at 17:45 trace Executed: 5 February 2023 at 17:50:54 nearly 6 minutes

test_relay on at 18:10 trace Executed: 5 February 2023 at 18:10:49 nearly 1 minute
test_relay off at 18:15 trace Executed: 5 February 2023 at 18:22:48 nearly 8 minutes
really weird times!
your clock_drift now shows -2 seconds at 18:28
nothing relevant in the home-assistant.log

At 17:51, if I’m reading it correctly (i.e., commas vs periods, I am in the US!), it looks like the drift was 1129 seconds (remember, the scale is milliseconds), which is almost 19 minutes, or 1/2 of the total time it was running.

When it samples depends on the same infrastructure as the time trigger, so the fact that the sampling is delayed is just further proof of the problem.

However, that shouldn’t affect the drift calculation, which is based on two sets of readings, each of the two clocks. The first “reference” set is captured shortly after startup, and the second set each time it samples. For each clock it calculates how much time elapsed between the reference and the sample.

(The elapsed time calculated from time.time() should be indicative of how much wall time actually elapsed, possibly affected by NTP clock adjustments, whereas the elapsed time calculated from hass.loop.time() is an indication of how much time HA’s scheduler thought should have elapsed.)

All being perfect the two clocks should show the same amount of time elapsed. The drift is then the difference between these two elapsed times. Positive values mean the scheduler is running too fast (time scheduled events happen too soon), whereas negative values mean the scheduler is running too slowly (time scheduled events happen late.)

After you’ve run for a while, does the drift sensor graph continue to slope in the same direction and at about the same rate? Or does it sometimes jump up and down, too? I’d be interested to see a longer run of that graph.

Clearly, though, something is wrong with the underlying OS clock that hass.loop.time() is based on (which is generally time.monotonic().)

Currently the integration writes INFO messages to home-assistant.log. To see them you may have to set:

logger:
  default: info

or

logger:
  default: warning
  logs:
    custom_components.clock_drift: info

Also, INFO messages don’t normally show up on the UI log page. You have to go look at the file itself, or click one of the buttons in the UI to download or load the entire log.

E.g., on my system, the last message was:

2023-02-05 16:46:16.600 INFO (MainThread) [custom_components.clock_drift] time_delta = 6610.037360668, loop_time_delta = 6610.037359718, drift = -0.000000950

The times in the log are in seconds. The first two numbers are the reference → sample elapsed time calculations, and the last is the difference, which is the drift.

Just FYI my clock drift is averaging about 0.0005ms (0.5us).

1 Like

It’s important to note whether or not it is relatively stable, or continues to slope and/or shows big (like seconds, minutes, etc.) jumps, over a period of time. The “steady state” value, so to speak, isn’t very meaningful, or at least, probably isn’t (especially values in the microseconds. That’s just “noise.”)

EDIT:

Oh, and BTW, big spikes (say milliseconds, and where it goes back to the steady state value), could be indicative of poorly behaving code, e.g., that might be doing I/O in the event loop. Any jump 0.1 sec or more should also generate an asyncio warning if its debug mode is enabled.

Yeah, it has only been running for 9 hours but looks pretty flat on average.

1 Like

todays drift, 8.3 hours