I think above looks pretty good, going back to the top here, 118 cycles = 0.2m3, how would I put this in the template to proplery calculate flow/usage?
I noticed that from the top to the bottom picture, the range of values changed quite a bit. In the top picture, the x-axis is going from (~60 to ~110) while in the last picture they only go from ~70 to ~80. Did you move it or end up going with the Y-axis maybe? You definitely want to go with the axis that gives you the largest difference between highs and lows, that way it’s easier to identify when you’ve gone high/low. Assuming the x-axis data looks the same as in the top picture, I’d probably go with counting high at ~95 and low at ~70 (just eyeballing).
This should get you to the right gas rate/consumptions, based on what you counted.
#118 counts per 0.2m3, or 590 per m3, multiplied by 2 to get per minute based on update interval
  - platform: template
    name: "Gas Rate"
    lambda: |-
      int temp = id(gas_counter);
      id(gas_counter) -= temp;
      float temp2 = temp;
      float temp3 = (temp2/590)*2;
      return temp3;
    update_interval: 30s
    unit_of_measurement: m³/min
    device_class: 'gas'

  - platform: template
    name: "Gas Total"
    lambda: |-
      float temp = id(gas_counter_total);
      return temp/590;
    update_interval: 1s
    unit_of_measurement: 'm³'
    state_class: 'total_increasing'
    device_class: 'gas'
I got the axis names messed up in that first screenshot, then got the axis wrong again in the second screenshot, the correct axis is the last one there with the lines (real X). Because the other two axis had some sort of ballooning, which I assume was the diaphragm moving really slowly, but the X axis did not have this so it looked like the cleanest axis to use
I’d probably go with counting high at ~95 and low at ~70 (just eyeballing).
Where are these numbers from? Is it not the highest and lowest point? When the heaters going full blast (screenshot 3 from before) the lowest is -83 and the highest is like -68, I assume when you use “~” you mean minus (-) not around (~), or ~-…
Thanks for doing those calculations, gas total is working, but gas rate seems stuck at 0m3/min
Are you talking about the bit I circled in red? I think that’s just the diaphragm moving very slowly from a pilot light, so the fact that you can see it is a good sign (since it means it’s more sensitive).
I just eyeballed the same graph (so roughly where the green lines are in my picture.
If it’s working, then there isn’t necessarily a reason you HAVE to change it, but I’d definitely go with the axis I highlighted in my picture since it’s got the largest swing from high to low. In regards to your gas rate not moving, I think that just comes down to the fact that cubic meters are so much larger than cubic feet and you’re using a very tiny percentage of a cubic meter per minute (whereas when my furnace is running I’m using a big percentage of a cubic foot per minute). Might be worth using a rate per 15 minutes (or another unit like cubic feet). Not sure what would be more meaningful to you.
I noticed the style of a few suggestions and comments on this thread (mainly between @alexhyde and @brooksben11 ) which I really like as general development principles (and think contributed to productive/faster troubleshooting). Many are on the site guidelines. Probably pro developers know this stuff by heart but the rest of us might take-away a few things I reckon.
They are something roughly like:
Clear OP
Share visuals and your config
Visualise your sensor data (I like Grafana for granular Viz).
Have lots of lower level intermediate sensors during development for debugging and consolidate/internalise them once things are stable.
Strip things back to minimal for debugging.
suspect it’s hardware (especially power related or connections).
I think learning to debug ESPHOME projects is an important skill which I don’t see discussed too much at a meta level?
I have changed to the axis you have highlighted (which was the Y axis, ignore the axis names in the screenshot) and have a peculiarity, apparently I have use 17.2 m³ of gas in 1 hour, which seems impractical. I am 100% sure that there was 118 pulses in the 5 minutes, using 0.2m3.
Im not insane that theres a 0.2m3 difference between these photos?
@brooksben11 has been a great help in this project, the understandings of how this sensor works/how we calculate gas usage based on it is a bit out of my pay grade. hopefully the next person to see this thread can skip my headaches and mistakes and jump right to a working sensor
It’s a cubic unit (1000x1000x1000), so it would be a LOT more mm3 (and I also don’t think Home Assistant would know what to do with mm3 anyways). But, in looking at the picture of your meter I also see a better way to count cycles: the red dial. Looks like one full rotation is equal to 0.05m3, so I’d just count how many cycles for it to rotate once. Then convert it to the equivalent cycles for one cubic meter (1/0.05=20 so just multiply the cycles for one rotation of the dial by 20 and you’ll have how many cycles for one cubic meter of gas).
Very kind words! Absolutely more than happy to help you (or anyone else) out. It’s how we all learn; can’t count the number of times someone else’s help/post has guided me along with a project.
I have tried multiple locations: On the portion below the dials (the “belly”): front bottom, middle, top and back bottom, middle, top. Additionally, at the very top of the meter.
Unfortunately all the locations give very small magnitude. The best is the backside middle but even there I only get ~20uT peak-peak, so 10x less magnitude than the water meter!
As a matter of fact, the integrated “Calibration” method doesn’t seem to work … nothing happens. But I can manually enter the thresholds.
Your water meter likely has a magnet specifically so that the utility can measure the rotation whereas your gas meter doesn’t and you’re just measuring the change in the magnetic field from the movement of metal.
I don’t remember the actual values I got for either my water or gas meters; all that’s important is there’s a clearly visible pattern with usage.
Hmm, but since when does (non magnetic) moving metal create a magnetic field?
I thought the disk must have a magnet … isn’t this how the actual meter for the utility is measured as well?
My concern with such small magnitudes is low SNR … which means we’re way more sensitive if things change slightly, e.g. sensor moves a bit etc.
It’s magnetic, it just isn’t a ‘magnet’. Additionally, this sensor isn’t really intended to sense a magnet, but rather the magnetic field of the earth (a compass). It just happens that magnetic metal affects this field in a way that is detectable.
Not sure what disk you’re referring to, but I believe these types of meters typically have a mechanical linkage that is used to turn the meter dial.
Definitely get this. Your specific meter might have fewer metal parts inside that’s causing a lower signal, but like I said, I don’t actually remember what kind of readings I got, so it might not be any different.
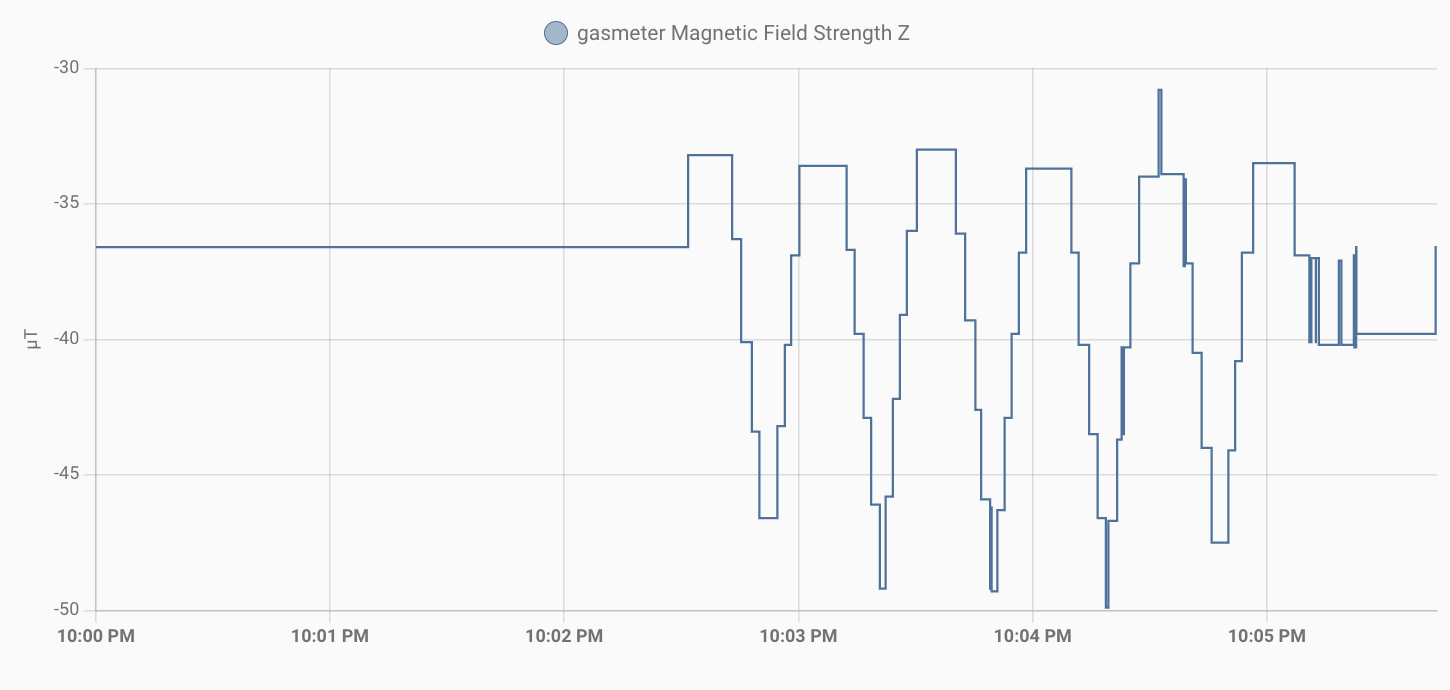
I dream of such a wide variation… Bigger is of course better, but the main thing is if it’s reliable, then it should be fine. This is mine, for example:
Which is less than it appears you are getting. It is, however, clearly working. As others have stated, the sensor is detecting the movement of magnetic material such as steel/iron. If there’s not a lot of it, the variation won’t be as high. In some cases, the manufacturer may include a magnet in the device to enable sensors to pick things up a lot better, but it’s not always the case.
I am using a “GY-273 HMC5883L Triple Axis Compass Magnetometer Sensor Module For 3.3 v 5 v” (full Aliexpress description). It has HMC5883L printed on it, but it’s actually a clone of that card and you need to use the QMC5883L driver ie:
sensor:
  - platform: qmc5883l
So, there is that. It cost all of US$2.44, so I can live with that.
Nope. Pretty much copied one of the examples others have used. Maybe post your code if it’s different, but first thing I’d check would be the update_interval settings eg: