How do you run Home Assistant?
I’m also facing some strange behaviour. 2 Directions, South (2.5 kWp) and West (5.8 kWp). Inverter can do 6kWp so i added these numbers to 2 services. I only see a max of ~4kW. Mornings and evenings are usually pretty correct.

calculating the forecast, for today it was ~36kWh, reality 49kWh.
Do i miss something ? location, Azimuth and declination are correct.
thanks for any hint
Hi,
I tried to access https://forecast.solar/ to get an API key, but it seems to be down. Am I trying to access the wrong site, or do they have problems right now?
Problems right now. My numbers have been unavailable all day.
3 Likes
Hi all,
New to the world of PVs and HA - but having fun learning.
I have added Forecast.Solar as an integration and created three services, Home-East, Home-North and Home-West for my three arrays. I have measured the declination of the arrays (22°) and azimuth (105°E, 15°N, 285°W).
East array - 7 panels @ 440 W = 3,080 W
North array - 11 panels @ 440 W = 4,840 W
West array - 5 panels @ 440 W = 2,200 W
The inverter is a GoodWe 8kW inverter.
I have entered the above values in the corresponding three services and included the three forecasts in my Solar Panels Energy graph.

I understand this is just an estimation of energy production, and not something I should ‘hang my hat on’, but still I thought it would be closer than this … (only able to add 1 image to this post … see image in next post).
If I enter the Total Watt Peak Power for my entire system in to each service (i.e. 10,120 watts) instead of the Total Watt Peak Power for each indvidual array the resulting prediction resembles more closely the actual energy generated … (only able to add 1 image to this post … see following posts for next image)
Am I misunderstanding how Forecast.Solar needs to be configured?

With Total Watt Peak Power on each of the three services set to total peak power for entire system (i.e. 10,120 W) …

Probably not. After years of trying everything to get a good match, I find for myself that the solar forecast integration this year is almost consistently half actual generated in summer and double actual in winter.
Solcast, on the other hand, is running at 90-105% actual to forecast, day after day.
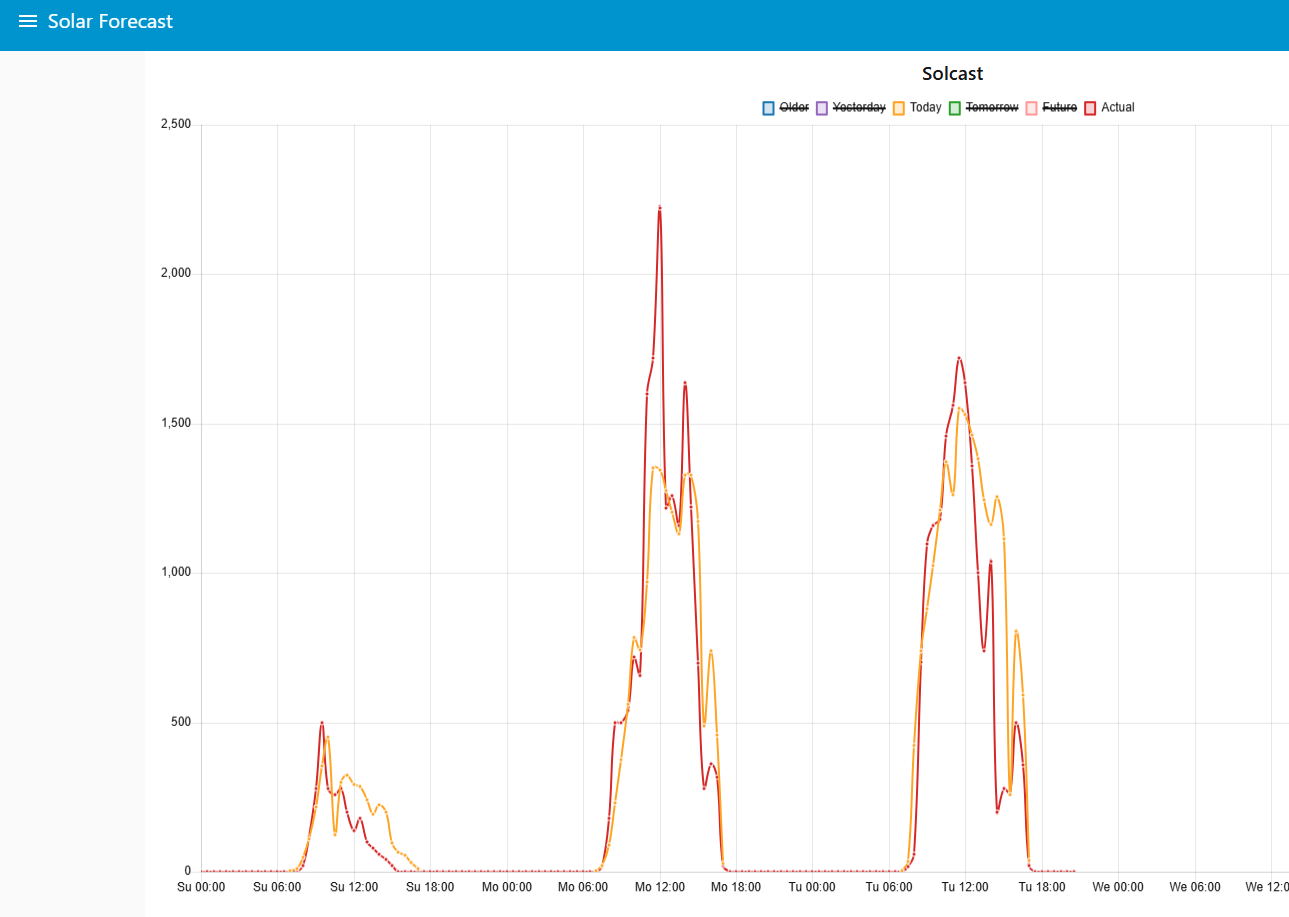
Here is yesterday and today…

For yesterday:
forecast.solar, up to 09:00, gave a total forecast for the day ahead of 11.2
Solcast, at 02:00, gave a total forecast for the day of 16.1
The actual generated was 15.2, hence Solcast was 94%, and forecast.solar was 136% (actual/forecast).
I think that the figures speak for themselves.
exactly the same for me. forecast is approx half what it is (summer here)
Maybe I haven’t paid enough attention, but is there any way to configure this correctly? I have one integration with two services, for the two strings of panels on my inverter. I can set a maximum inverter limit for each string but not for the sum of them. It’s also mostly under-reporting the forecast. I think with one service (one string) the forecast was more closely matched to the actual output.
My Problem is, that the forecast does not show the sum of both entries but only the estimated value of one entry of my inverter. The estimated value of both entries of my inverter should be 11,5 kWH but the chart shows 5,8. The real value is the stapled bar which is correct.
Does anybody know how to fix this?

It does show both. But their are expecting exactly the same ![]() So It looks, like only one line, their are covering each other.
So It looks, like only one line, their are covering each other.
![]()
![]()
![]() thank you!!! I would never thought about this…. Better would be, if there would also be a stapled bar or line so that you see the overall estimated yield (just like the real yield)
thank you!!! I would never thought about this…. Better would be, if there would also be a stapled bar or line so that you see the overall estimated yield (just like the real yield)
1 Like
i didnt change anything but now I have a stapled line for the forecast… weird but nice!
Guys, was this issue with 1h shift to the right ever solved? I have solcast, it shows good but it is shifted one hour to the right. Any solution ?
Exactly the same problem for me. Three arrays, all separately set up.
North-East (4kWp), South-East (5.3kWp) and South-West (4kWp)… forecast is always too low.
I believe the ‘phantom 1 hour shift’ remains a moot point.
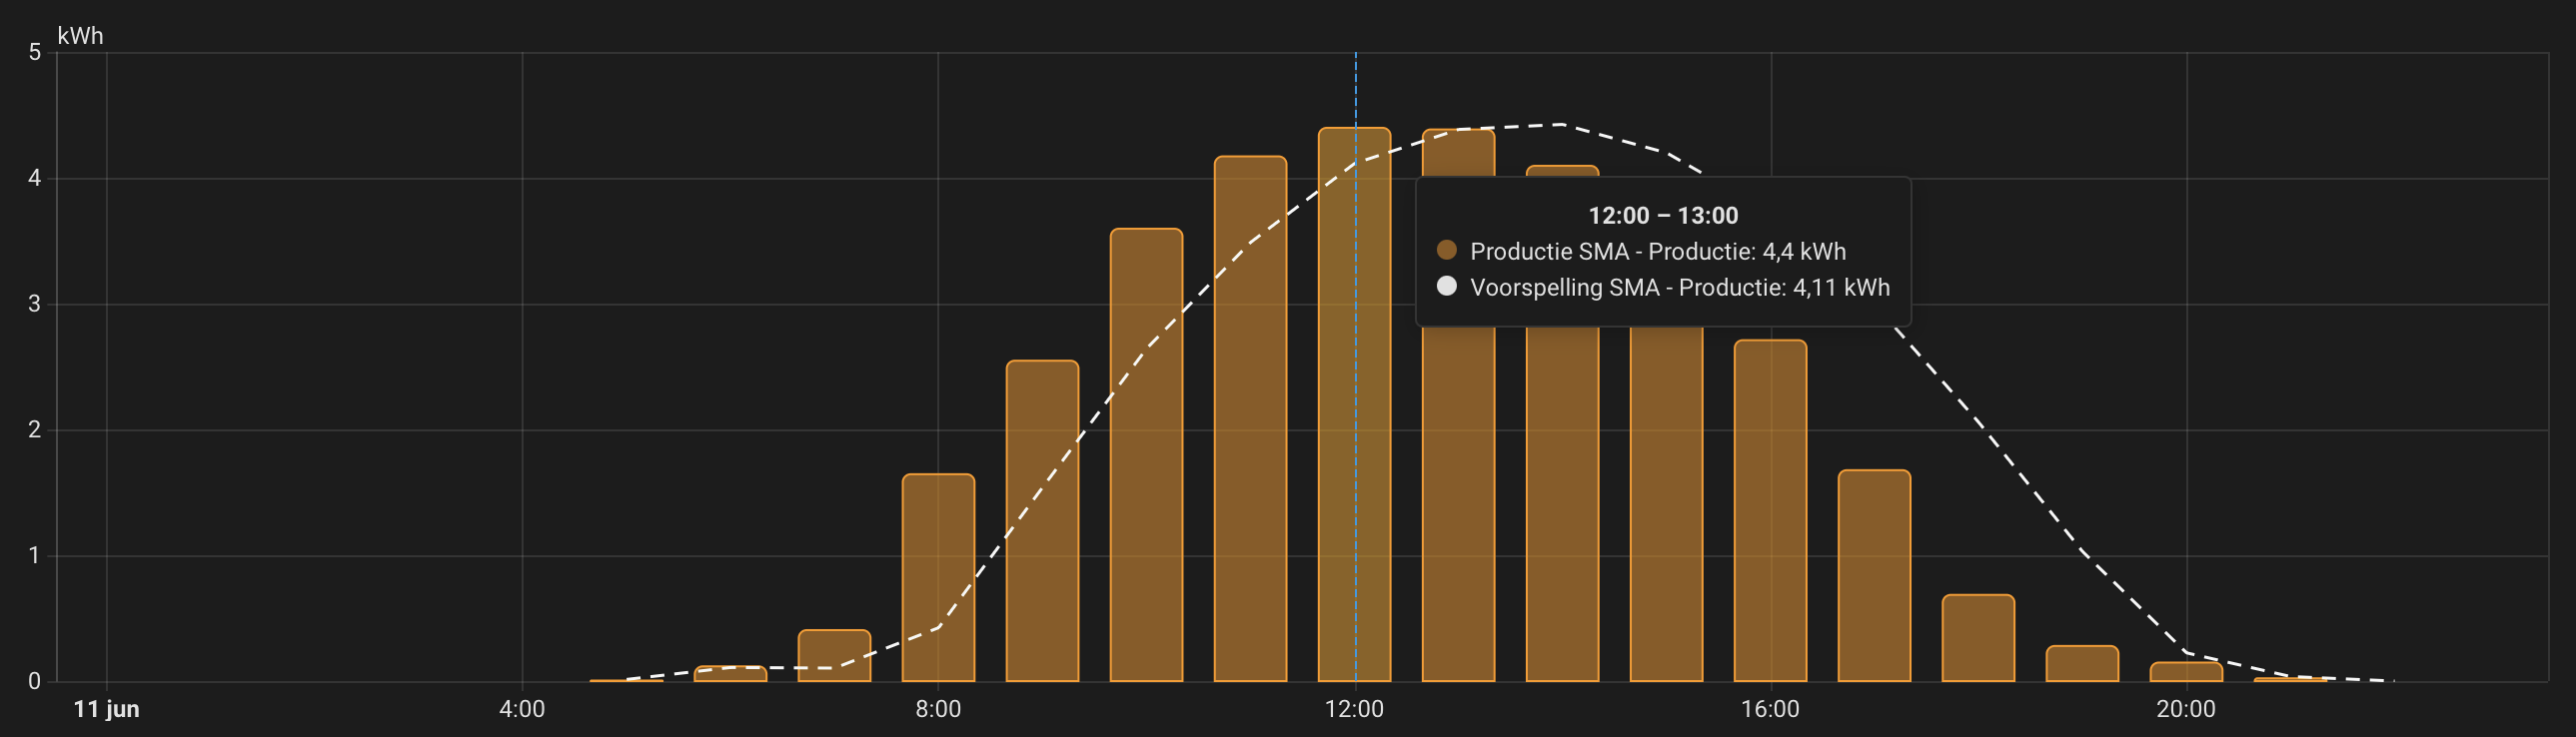
To have a shift to the right, you must have something against which to measure this. If you have ‘Solcast’ as a forecast, then remember that this is always UTC timestamped at the end of the half-hour period to which it relates.
Solar forecast is going to be ‘average power’ and over a period. Actual generated is usually total energy, and over a different period.
The main issue, I believe, is just where to plot both bars (solar) and points (forecast) on a time-graph.
The HA Energy Dashboard plots actual solar energy as a bar eg 12:00 to 13:00, plotted centred on 12:00.
The forecast is plotted as a point, again at 12:00 for the ‘forecast 12:00 to 13:00’. However, Solcast forecast is for 12:00 to 12:30 (reported at 12:30) and for 12:30 to 13:00 (reported at 13:00). So to have any chance of getting the two matching on a graph you have to add the 12:30 to the 13:00, average it, and plot at 12:00.
Naturally, if you add the 12:30 to the 13:00 and plot it at 13:00 you will be 1 hour out.
There are many potential reasons for a 1 hour difference - DST, Europe +1 over GMT…
Does it really matter that much?
A solution?
Do it all yourself. Work out what you have, what it represents, and where you want to plot it on your own graph.
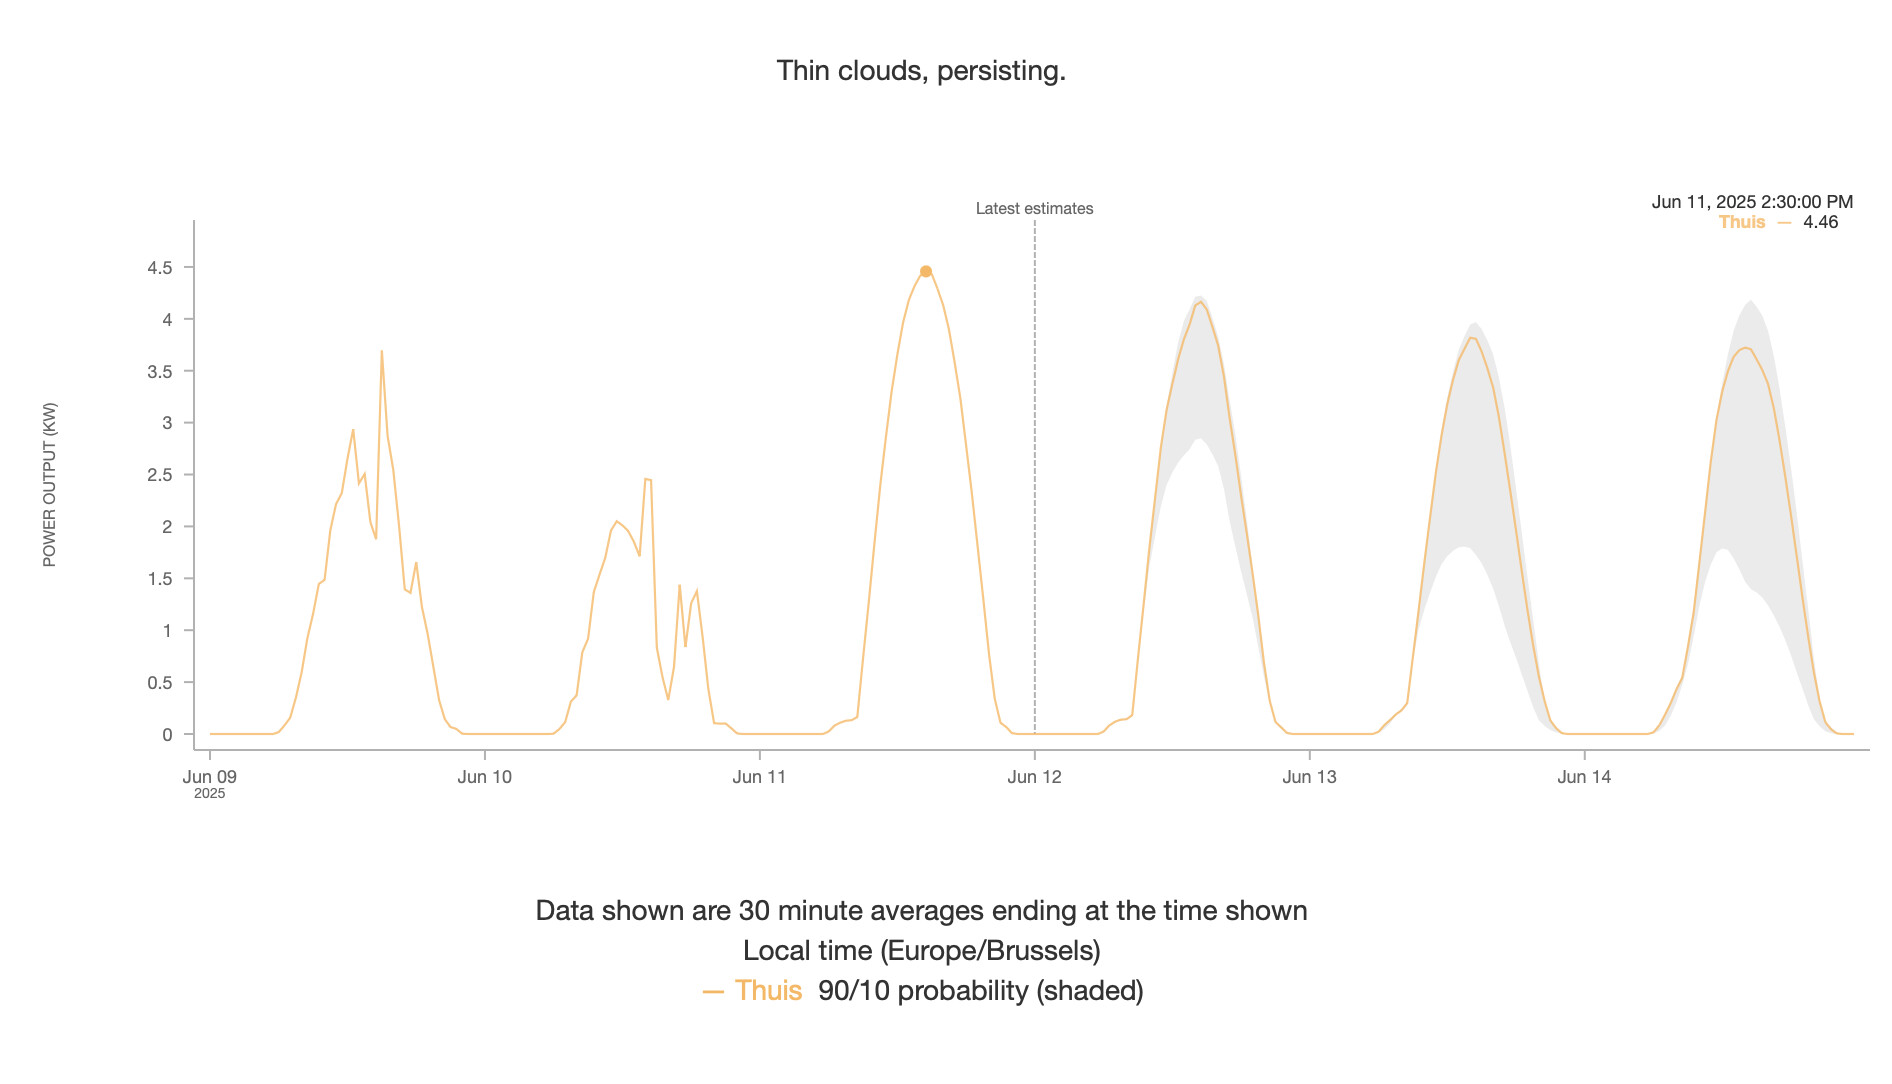
Today, yesterday, and the day before. Orange line is the Solcast forecast (best of the day), Red line is the actual solar PV recorded, both for the half-hour, plotted for the period starting (hence the forecast for 12:00 to 12:30 and the actual recorded over 12:00 to 12:30 are both plotted at 12:00).
For myself I think that this is the best I will ever get.
I have a similar issue. My forecast is mostly accurate. No issues there. However it’s always shifted about 2h to the right.
Both time zones are set the same (Brussels). However my real peak is at 13h while the solcast peak is at 14:30 which is obviously wrong. I guess the conversion between UTC and local time is off. Is there an easy way to compensate for this so my forecast aligns with my real data?