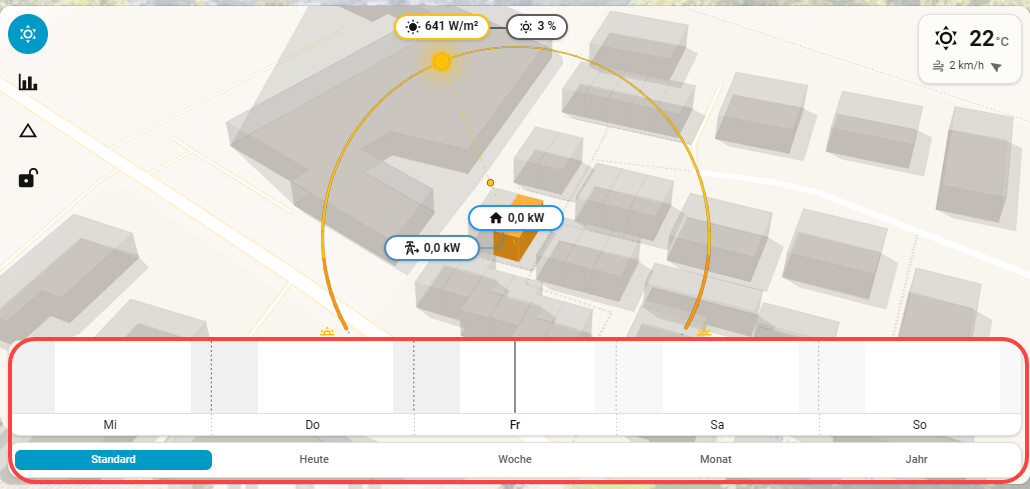
Hi, in the latest versions above 1.6 the cloud and sun forecast is missing in my dashboard:
Thanks alot.
Hi, in the latest versions above 1.6 the cloud and sun forecast is missing in my dashboard:
Adding a warning here for those that use Helios. Double and Triple check the values that Helios displays and compare them directly with your energy dashboard. Helios claims to pull all data directly from the energy dashboard based on its documentation, but this is false. What it does is it pulls some data, and derives the rest by using math.
I'm not entirely sure which parts do what as I am no dev that can read source codes, but based on my own experience using Helios, my solar export readings is entirely wrong, with Helios always displaying different values from what my Energy Dashboard is showing.
I have also been tracking an issue on the Github by others experiencing similar problems and trying to get the dev to bring back setting up custom entities instead with no success. Instead the dev seems to double down on their method that so called displaying the "truth" from your energy dashboard.
So does that mean the HA dashboard is displaying false information and Helios is displaying the real thing?
Liked the idea, but the card keeps changing, and my family could not keep up with the changes, and gradually stopped understanding it. so sadly have to remove it, lost the WAF factor
Hi!
Sorry in advance for how long this post is. I spent a long time writing it, trying to answer everyone properly. I have tried to lay it out as clearly as I could so it is not too heavy going :s
Where Helios stands, and an apology to the five of you I left waiting
First, the apology, because it is owed.
Skyflash, LozinOz, aeroschmelz, eriri, pixi: you each wrote here and none of you got an answer. That is on me.
I have been handling feedback on GitHub, where an issue gets a number and stays visible until it is closed, and I let that become the only place I looked. Between the card, the integration, the releases and everything around them, these two repositories have taken hundreds of hours in three months, and somewhere in that I stopped thinking to come back here at all. That is an explanation, not an excuse: it was never a judgement about this forum or about your messages, and it left the most visible page about Helios looking like a project nobody was tending. I am sorry.
Second, the bigger apology, and the reason I want to write this properly rather than post another release note.
Helios spent its first two months looking for what it was.
There was a WebGL map, then there was not. There was a LiDAR terrain pipeline, then there was not. There was a dashboard, then there was not. Features arrived and left, and the card’s layout moved more than once. If you installed it in May and again in July you installed two fairly different things. Several of you said so, politely, and you were right.
I want to explain the three decisions behind that, because they were not whims, and then tell you what I have frozen.
Performance. The card ran on WebGL. It looked impressive and it was too heavy: it excluded old tablets, wall panels and low-end phones, which is exactly the hardware people leave a dashboard running on all day. The whole renderer was rewritten as a 2.5D engine with no WebGL at all. Today the card paints a tilted vector basemap on a plain 2D canvas with SVG overlays. Nothing else.
Correctness. Helios used to compute more of its own numbers, including its own PV forecast. It no longer does. Everything solar, grid and battery is read from the Home Assistant Energy dashboard, and the forecast is read from whatever solar-forecast provider you configured in Home Assistant. The card’s job is to show your numbers, not to have opinions about them.
To be precise, because precision is the point: one figure is computed, home consumption, and it has to be, because no sensor exists for it. Helios uses the Energy dashboard’s own formula, solar plus import minus export minus battery. Everything else is either a live sensor reading or your own meter data from the recorder statistics. Helios never derives a “now” from a cumulative meter, and never invents a figure your dashboard does not have.
The LiDAR, which is the removal that hurt. It cast real terrain shadows and it was the most spectacular thing the card did. I removed it because it only worked in the handful of countries that publish open elevation data. It made Helios a different product depending on where you live, and I could not accept that. Losing the wow was worth everyone standing on equal ground.
What the LiDAR was really reaching for was accuracy about your site: your shading, your horizon, your particular sky. That is now handled somewhere better. Helios Forecast, a separate integration on my GitHub, learns from your own recorded production, so it absorbs shading, soiling, an orientation a few degrees off, inverter clipping. It gets there by watching your panels rather than by modelling your terrain, which means it works for every installation, everywhere, with no elevation data at all. It runs on your server, feeds the official Energy dashboard on its own, and does not need the card.
Now, what is frozen.
The visual identity and the feature set of this card are settled. I am not going to keep moving it under you. pixi, that is the direct answer to your message, and I understood it: a card your family has to relearn every few weeks is a card that has failed, however good it looks.
And here is what I got wrong at a deeper level. I was trying to make one visualisation that worked perfectly for everybody, and that was a mistake. No single picture suits every household. So from now on, rather than changing this card, Helios will gain new cards: other ways of looking at the same data, so you can pick the one that speaks to your home. I am working on other kinds of dataviz with exactly that goal. The point of this project has never been the scene itself, it is to get people, and families, to actually see and understand what they consume. More choice serves that better than one card that keeps changing.
Your individual points, at last.
Skyflash, you are not blind, the documentation is gone because the feature is gone. There is no .tif setting any more. Shadows are still cast, but from building footprints only, so the hill behind your house will not cast anything. That was your exact use case and I am sorry. If terrain shading genuinely matters to you, say so: it is not on the roadmap, but knowing someone relies on it changes how I weigh it.
LozinOz, part of what you hit has since been fixed, and part of it is still on me. You wrote on 3 July, so you were on 2026.7.2 at the latest. Since 2026.8.0 a multi-meter grid is no longer lumped into one flow: every meter draws its own band, in the timeline and on the day curve alike, so your three Time of Use meters and your controlled load should each read separately now. Please update first, then tell me what is left.
What is genuinely still missing is the naming. Each solar string gets its own name, but grid and battery still show a single label taken from the first source, so your four meters draw as four distinct bands all carrying the same title. That is a real gap. It is now tracked as issue #329 on the repository, assigned and scheduled for the 2026.9.0 milestone.
The home total at the bottom left is not one of your meters: it is the Energy dashboard’s own balance, so what the house is drawing right now across every source at once. And if you can tell me exactly where you see kW instead of kWh, I will take that one too.
aeroschmelz, the missing cloud and sun layers should not happen and your screenshot is enough to work from. Could you tell me your current version, and whether the irradiance curve is missing as well or only the cloud layers? I would rather track that as an issue than lose it here. On DWD: Open-Meteo is the only provider I can use without asking every user for an API key, and that is a line I do not want to cross. But Helios accepts an irradiance sensor of your own as an override, so if you have a DWD-based sensor, feed it in and the card will use your figure instead of the model’s.
eriri, your warning deserves a straight answer rather than a defence. The paragraph above on correctness is that answer: one computed figure, home consumption, and everything else measured. But you are describing solar export, and that is a plain meter reading that should match your dashboard exactly. If it does not, that is a bug and I want it. Could you open an issue with the value Helios shows, the value the Energy dashboard shows for the same period, and how your grid source is wired, in particular whether your export sensor is a separate meter or a signed net sensor? A signed net sensor placed in the export slot produces precisely the mismatch you describe, and if that is what is happening, Helios should be detecting it and telling you rather than showing you a wrong number. On custom entities, I did push back, and I owe you the reason rather than a refusal: reading the Energy dashboard is what guarantees the card can never disagree with Home Assistant’s own figures. Your case is the one where that principle costs you something, and I am listening.
pixi, answered above, and thank you for saying it plainly. If you ever feel like trying again, I would genuinely like to know whether it holds up this time.
And the practical part, so nobody has to wait a month again.
If something is broken or a number looks wrong, the fastest way to reach me by far is a GitHub issue: Issues · ReikanYsora/Helios · GitHub
It gets a number, a label and a milestone, it stays in front of me until it is closed, and you get notified when it moves. LozinOz’s report above became issue #329 in the time it took me to write this. Nothing here gets that treatment, however good my intentions are.
And before opening one, it may already be answered. There is now a Help page on the project site covering the problems that come up most often: an empty card, live values stuck on dashes, a house that renders in the wrong place or only halfway, how to group your devices, and where the weather data comes from.
I will keep watching this thread now. But GitHub will always be faster.
To all five, and to anyone reading later: this thread will not go quiet again.
PS: I have asked for this thread to be renamed rather than starting a new one. I would rather own the mistakes that are in it than bury them somewhere else, but the title no longer describes what the card does at all, and I do not want to mislead anyone who lands here.
You are also very welcome to have a look at the site, which explains in detail how it all works, hosts the Help page above and has live demos, so you can see what Helios has become and judge for yourselves: https://helios-ha.org
Thank you all 
Cheers 
ReikanYsora / Jérôme
HI, Does this intergration supporting a zoom ? I am interesting a shadow from my building, and less that happen in the landscape.
Hi
No, because even if it looks like 3D, as I mentioned earlier, it’s 2.5D with a fixed zoom and double axis rotations.
Sorry
I installed your card and it’s beyond awesome!!
It looks like openstreetmap doesnt show my house as a building, so the card looks pretty plain. went to openstreetmap to edit the map, did that and hit upload. Nothing on the card yet, but I dont know how long those edits take to take effect… Is there any other way to display a nice terrain.. ?
Hi, and thank you
It varies quite a bit, as I use OpenFreeMap to fetch vector maps from OpenStreetMap, and we have to wait for them to sync up. You don’t need to do anything else in the meantime, as soon as the data update propagates, everything will automatically show up in Helios, max 2/3 weeks.
In the meantime, it all depends on what you mean by “nice” terrain
Everything is fully customizable if you switch to “Custom” rendering mode in the editor, so you can get whatever color theme you want on the map.
Hi @ReikanYsora,
I just installed this card and it is fantastic. Thank you very much for contributing to the HA community in such a great way.
Cheers, Robert
Hi Robert,
Thank you so much, this genuinely made my day. Hearing that the card is useful to you is the whole reason I keep working on it.
If you ever spot something odd or have an idea to make it better, please do not hesitate to reach out, feedback from people actually using it is what shapes where it goes next.
Cheers
Thanks for constructive and appreciated reply - all good we all want this great idea to improve.
I am using Helios Forecast in great detail - I intend for it to be the Solar Forecast engine for our home, but its not there yet - massively wrong on one solar array, (actual vs forecast per day) - im investigating why (PV fault, Shading, Cloud cover etc) however for what ever reason its caused by, for that PV1 array Helios Daily Forecast is only ~20% correct ie massive disfference. So Im wondering how , when it Helios will see this and adjust future forecasts?
Hi @LozinOz !
Happy to explain how the learning handles this, and to dig in with you.
First, a bit of perspective: a persistent shortfall this large (20% of expected) is well outside normal weather scatter, so it’s genuinely worth investigating.
Accuracy feedback has generally been good, so a delta that big stands out. It could be a configuration thing (often the per-line setup, more below), or a real issue on the array itself, which is exactly what you’re already looking into (fault, shading, cloud).
One thing that would help pin it down: which way is it off, is the forecast too high (the array really produces ~20%), or too low (it predicts ~20% of what the array actually makes)?
Those point to different places. Either way, if you can share your config on GitHub, we’ll get to the bottom of it quickly.
Now, how the learning works, because it matters here: Helios-Forecast starts from a physical model (your geometry + Open-Meteo weather + a temperature derate), then learns a correction from your own production. It builds an “analog” library from roughly the last 60 days of that array’s real output, tagging every past hour with its conditions (sun altitude/azimuth, cloud cover, temperature).
For a future hour it finds the most similar past hours and forecasts from what the array actually produced then, so the learned side already contains real shading, soiling and array-specific losses, not the textbook value.
The two are blended by confidence: with few close matches (cold start, unusual sky) it leans on the physics; as similar days accumulate, it leans on your real numbers.
So if the array genuinely runs low:
The most likely config culprit for “one array is way off”: the learning is per-line. Make sure PV1 is its own Helios-Forecast entry, wired to PV1’s own energy (kWh) sensor with long-term statistics. If PV1 is folded into a combined sensor/entry, the learning can only calibrate the combined output, it can’t isolate and correct PV1 on its own.
One entry per line is the recommended setup for exactly this case
Still early days and moving fast, so this kind of real-world feedback is gold.
Share the config and we’ll track it down together, thanks for putting it through its paces on a tricky array.
Cheers
ReikanYsora / Jérôme
Hi Jérôme,
Thanks very much for the detailed explanation. It clarified a lot about how Helios Forecast actually learns.
After reading your reply I went back and audited my configuration, and I discovered something important that was entirely my mistake.
Although I had correctly configured one Helios Forecast entry per array (PV1 and PV2), I had accidentally selected my PV1/PV2 power sensors (W) as the production sensors used for learning, instead of cumulative energy (kWh) sensors.
After re-reading both your explanation and the configuration hint, I realised Helios expects a cumulative total_increasing energy sensor with long-term statistics.
I’ve now corrected both entries to use my guarded lifetime energy sensors instead:
sensor.pv1_energy_solar_ti_guardedsensor.pv2_energy_solar_ti_guardedThese are cumulative kWh sensors with long-term statistics, so they should be much more appropriate for the analog learning.
So before drawing any conclusions about forecast quality, I’m going to let Helios run with the corrected configuration for a while and see how the learning develops.
That said, I’m still seeing an interesting difference between the two arrays.
PV2 is generally below forecast but follows the expected curve reasonably well. I suspect some of the repeated dips are local tree shading.
PV1, however, appears to be consistently much further below forecast than PV2. My current suspicion is that this may indicate an underlying array issue rather than simply forecast error. I’ll continue investigating the electrical side while Helios learns from the corrected data.
One question, if I may.
My PV lifetime sensors are “guarded” total_increasing sensors which preserve the cumulative lifetime value if the inverter briefly reports an invalid value or resets. They never decrease and continue accumulating correctly after recovery.
Is that exactly the sort of cumulative energy sensor Helios expects, or do you specifically recommend using the inverter’s raw lifetime production sensor whenever available?
I’m currently running Helios Forecast 2026.8.2.
Finally, I wanted to say that I’m genuinely impressed with what you’ve built. I’m developing a companion analytics layer called Solar Intelligence Suite (SIS) which sits above Helios—not to replace its forecasting—but to analyse long-term behaviour, compare learned forecasts with actual production, investigate persistent forecast bias, and help explain why differences occur.
The more I learn about Helios’s analog learning, the more I see the two projects as complementary rather than overlapping.
Thanks again for taking the time to explain how Helios works. I’ll report back after giving it some time to learn from the corrected inputs.
Hi @LozinOz ,
Really glad the explanation helped, and thank you for auditing your setup so carefully.
On your main question: yes, a guarded total_increasing lifetime energy sensor (kWh) with long-term statistics is exactly what Helios wants, and it’s the better choice over a raw inverter sensor.
Here’s the why, and it also explains a lot of what you saw. Helios doesn’t read the sensor’s live value for learning; it reads the entity’s hourly long-term statistics and takes the change (the energy produced in each hour), in kWh. So it needs a sensor that:
device_class: energy, state_class: total_increasing or total), so HA generates the hourly sum/change statistics, andYour guarded sensors fit that perfectly. A raw inverter lifetime sensor also works, but only as long as it never reports invalid/zero blips: when it does, HA has to treat the drop as a meter reset, and near an hour boundary that can occasionally misattribute a chunk of energy to the wrong hour. Your guard avoids exactly that, so I’d stay on the guarded ones.
Two things that follow directly from your fix:
change, so the learning was effectively off and the reliability index was capped. What you were comparing against was the pure physical model, uncorrected. Now that it has real kWh history, the analog learning will actually start adapting to your site.(Small note: you’re on 2026.8.2. There’s a 2026.8.3 beta out that only reduces refresh CPU cost on low-power hardware, with no behaviour change, so no rush, just so you know it exists.)
On Solar Intelligence Suite: I love this, and I fully agree it’s complementary. To make it easier, Helios already exposes what you’d build on:
So SIS can read predicted-vs-actual and the uncertainty band directly out of HA without re-deriving anything. Happy to point you at the exact statistic_ids and the websocket command if you go that way.
Thanks again for the kind words and the thorough testing, and please report back once it’s had time to learn.
Cheers
ReikanYsora / Jérôme
Hi @ReikanYsora,
I have a Ecowitt WS90 (Shelly) weather station which provides plenty of sensors in HA. I can add most of these in Helios Optional Sensors. But it would be great if Helios would support the following additional sensors/units:
The optional cloudiness sensor currently supports percentage values. The ecowitt ws90 has a sensor.ENTITY_NAME_weather_condition: it’s status can be: sunny, cloudy, partlycloudy, clear-night, rainy, snowy
There is also a binary_sensor.ENTITY_NAME.rain_status which indicates whether its currently raining (on) or not (off)
Cheers, Robert
Hi @starob
Thanks for your feedback and your ideas. I think I’ll need to use a bit of the coffee donations I’ve received to invest in a weather station to make development easier for me. Could you confirm if this is indeed the right model? ECOWITT WS2910 Professional Digital WiFi Weather Station with Color Screen, 7 in 1 Solar Powered Wireless Outdoor Sensor Indoor 3 Built-in for Home Garden Farmhouse : Amazon.fr: Industrial & Scientific
I’m already struggling to code without battery management, so if I don’t have a weather station, I won’t get through it 
Cheers
Jérôme / ReikanYsora
Hi @ReikanYsora,
this is the one I’m using: https://us.shelly.com/products/ecowitt-ws90-7-in-1-weather-station
Shelly is reselling a modified version of the Ecowitt WS90 with an integrated Zigbee and Bluetooth Interface. It can connect directly to Zigbee2MQTT and does not require a bridge or cloud. I’m happy to support you with debugging if that makes any sense for you.
This are the sensors created in Home Assistant:
Cheers, Robert
Oh, this model sounds amazing!!
Unfortunately, it’s a bit too expensive for me
I think I’ll rely on your debugging support instead (for now) if you’re ok with that ? 
Thanks (a lot),
Cheers
Jérôme
I’m OK to support. When you are ready then tell me what you need.
