Custom component: Long Time State Storage (LTSS) utilizing TimescaleDB

haha yeah :slight_smile:
one another question ā€¦

Is there a possibility to work directly with the meter reading and to display the difference from the max yesterday and the max today? Then I could use the meter readings directly as sensors and would not always have to work with auxiliary sensors.

Currently it always shows the total meter reading: I would like to only show the difference / change over the last 24 hours.

Yes, this should be possible. You just have to determine the differences between individual values and then add them up. This is how I do it, for example, to determine my daily electricity consumption using a sensor that adds up the annual consumption. So similar to your sensor to the meter reading (ZƤhlerstand):

SELECT
  $__timeGroupAlias("time",$__interval)
  , SUM(a.value) AS "Schlafzimmer"
FROM
    (
    SELECT
        time
        , entity_id
        , SUM(state::FLOAT) AS usage
        , SUM(state::FLOAT) - COALESCE(LAG(SUM(state::FLOAT)) OVER (PARTITION BY entity_id ORDER BY time), 0) AS value
    FROM ltss
    WHERE $__timeFilter("time") 
        AND entity_id = 'sensor.energy_consumption_bedroom_energy_yearly' 
    GROUP BY 1,2
    ORDER BY 1,2
    ) AS a
WHERE a.usage != a.value
    AND a.value > 0
GROUP BY 1
ORDER BY 1

Hope that gives you an idea :wink:

1 Like

Hello,
sorry for the noob question, but I am at a bit of a loss at understanding what ltss does.

So, if I configure PostgreSQL as my database in the Recorder config and also specify the excludes and includes in Recorder config, wonā€™t Recorder then store everything I specified in ā€˜includeā€™ in the PostgreSQL database?

If not, a bonus question:
according to the instruction, ex-/includes are specified in the config of LTSS. Does this mean I need to specify this twice, once in Recorder and once in LTSS?

I think this previous post in this thread should give some clarity:

Thank you @freol for the quote. that does help me.

I hope it is okay to ask a follow-up question or two:

  • If Recorder is writing both states and events to the DB, then using LTSS will mean that all states are written/stored twice. Once by Recorder and once by LTSS. Correct? LTSS does not disable Recorder?
  • If LTSS does disable Recorder, would this mean that I am losing the events data? And if I wanted to record events, I would have to disable/remove LTSS.

Thank you very very very much for this! It was exactly what I needed. Set up everything yesterday, working like a charm. I did encounter a few things during my setup, itā€™s not a ltss issue but there are bits and pieces of information everywhere that I needed to gather to get everything up and running resulting in a ton of open browser tabs.
Tried to write down everything I did for the complete setup and published it here, hope it will help
others during the setup.

https://cristian.livadaru.net/home-assistant-grafana/

Cris

4 Likes

as mentioned in the description text latitude and longitude from sensor attributes are stored in the location column. but how can I use them in Grafana? I try to use a device_tracker in a Track Map but it needs latitude and longitude for thatā€¦ Does anybody have a Grafana example?

found it! In Grafana TrackMap Plugin you need to create two queries, for example for a device_tracker:

SELECT
  $__timeGroupAlias("time",$__interval,previous),
  st_y(Location) as latitude
FROM ltss
WHERE
  $__timeFilter("time") 
  AND entity_id = 'device_tracker.XXX'
  AND state NOT IN ('', 'unavailable')
GROUP BY 1,2
ORDER BY 1,2

and

SELECT
  $__timeGroupAlias("time",$__interval,previous),
  st_x(Location) as longitude
FROM ltss
WHERE
  $__timeFilter("time") 
  AND entity_id = 'device_tracker.XXX'
  AND state NOT IN ('', 'unavailable')
GROUP BY 1,2
ORDER BY 1,2

Interested in this since I currently use MQTT Eventstream ā†’ Telegraf (custom build with psql support) ā†’ Timescale. Iā€™m missing regular updates for sensors that donā€™t update that often. Is this something this component can do? That is to write states at least say every 5 mins?

Iā€™ve been using this component for a few months now, and itā€™s been great, but after adding solar panels to my setup, Iā€™ve noticed some issues with my queries, and I could use some help figuring out the solution.

When the solar panels are online, my power consumption drops to 0, which is recorded once. This stays at zero for long periods of time, meaning no new data is recorded for long periods of time.
When I graph the raw data, no problem (with the right line interpolation).
But when I try to time bucket my data, stuff gets completely out of wack. See below graph, with the raw data (graphed), raw data (points only) and the 5m time bucket, carrying forward where it should drop to 0:
image
My query:

SELECT
  time_bucket_gapfill('5m', "time") AS "time",
  locf(
    AVG(state_numeric)
  ) AS "Phase 2 5m"
FROM ltss
WHERE
  $__timeFilter("time")
  AND entity_id = 'sensor.power_consumed_phase_2'
GROUP BY time_bucket_gapfill('5m', "time")
ORDER BY 1

Any ideas how I could overcome this issue? This is my first time working with Timescale so I may be missing something obvious, would love any hints.

EDIT: To clarify, itā€™s hard to tell, but there are raw points at 0 every time.

This is not because of Timescale itself, but simply because of the structure of your data :wink:
It seems the query does exactly what it is supposed to do, which is to calculate the 5 minute average? Grafana then always takes the last value, so long. Until it gets a new value.
You can either try a SQL CTE to prepare your data accordingly, or you test once whether the specification of a value with which Grafana should interpret missing information, already helps. Like this: $__timeGroup(dateColumn,ā€˜5mā€™, 0)

Thanks for your reply. Iā€™m aware itā€™s not because of timescale or the ltss component, itā€™s just that, well, I got stuck on how to actually process the data, heh.

Grafana then always takes the last value, so long. Until it gets a new value.

time_bucket_gapfill, as far as I understand (and observe), is supposed to ā€œcreateā€ datapoints for Grafana, so there are no gaps for Grafana to fill. It consistently creates datapoints at every $interval, in this case 5m.
This is reflected also by my continuous aggregate tables/materialized views, which reflect the same ā€œwrongā€ data before hitting Grafana.
I have tried using the $__timeGroup("time",ā€˜5mā€™, 0), which, interestingly, does something, but Iā€™m not sure what. The resulting query functionally is identical to mine, but adding the macro makes Grafana handle it differently (but not correctly).
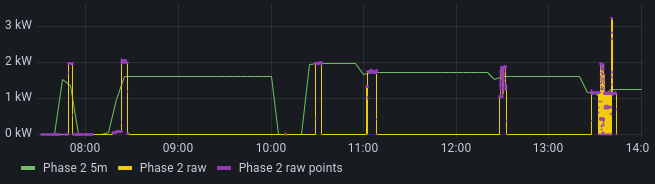
Below another graph, with the macroā€™d query in green, and a terrible hack that results in the correct data in red:
image
The query I came up with for this, while it does produce the correct data, is obviously extremely hacky and fragile, it first executes the actual query I want with a time_bucket_gapfill of less than the interval my data comes in (more than the interval, even setting it to 2s, completely messes up the data in a similar way to my original issue), as a subquery, then on the ā€œcompleteā€ gap-less data it executes the actual time bucket I want:

SELECT time_bucket_gapfill('5m', "time") AS "time",
  locf(
    AVG(state_numeric)
  ) AS "Phase 2 5m awful"
FROM (
  SELECT
    time_bucket_gapfill('0.5s', "time") AS "time",
    locf(
      AVG(state_numeric)
    ) AS state_numeric
  FROM ltss
  WHERE
    $__timeFilter("time")
    AND entity_id = 'sensor.power_consumed_phase_2'
  GROUP BY time_bucket_gapfill('0.5s', "time")
  ORDER BY 1
) AS t1
WHERE
  $__timeFilter("time")
GROUP BY time_bucket_gapfill('5m', "time")
ORDER BY 1

So in short, the issue is in the query somewhere, my ā€œworkaroundā€ in red produces the correct results I want to see, but seems like an incredibly inefficient hack and I imagine thereā€™s a much smarter way to do it.

@SharkWipf

Not sure if this has anything to do with the issue, but can you try to alter your initial query as follows:

SELECT
  time_bucket_gapfill('5m', "time") AS bucket,
  locf(
    AVG(state_numeric)
  ) AS "Phase 2 5m"
FROM ltss
WHERE
  $__timeFilter("time")
  AND entity_id = 'sensor.power_consumed_phase_2'
GROUP BY bucket
ORDER BY 1

And report back if that changes anything?

1 Like

No, this component simply listens in on (and writes to timescale) the state change events as produced by HA internally. As such, no ā€œextraā€ data points are inserted.

You may be interested in functionality such as time_bucket_gapfill and locf in timescale to take care of this during graphing, analysis etc?

Unfortunately no dice. Grafana requires a column called time, so calling it bucket fails it on that, and Postgres/Timescale doesnā€™t allow grouping by an alias, requires the same complete time_bucket_gapfill() to be in the GROUP BY (db query error: pq: no top level time_bucket_gapfill in group by clause).

So just Name the bucket column ā€œtimeā€ instead of ā€œbucketā€ and use ā€œGROUP BY 1ā€ instead. :wink:
Maybe you can execute the query directly with some DB client instead of Grafana? So that we get a better understanding of the structure of the data output.

Thatā€™s essentially my original query again, result is also identical to my original query.
Iā€™ve run this query against psql directly, as well as my raw data query (without bucketing), the former shown below, the latter Iā€™ve uploaded here because of its size: https://clbin.com/W1man

The raw query is just:

SELECT
  "time",
  state_numeric AS "Phase 2 raw"
FROM ltss
WHERE
  "time" BETWEEN '2022-10-08T08:00:05.341Z' AND '2022-10-08T12:07:35.001Z'
  AND entity_id = 'sensor.power_consumed_phase_2'
ORDER BY 1

@SharkWipf
Hmm, I think you should actually be able to get this done without the locf function. How about this:

SELECT
  time_bucket_gapfill('5m', "time") AS "time",
  COALESCE(
    AVG(state_numeric),
    0.0
  ) AS "Phase 2 5m"
FROM ltss
WHERE
  $__timeFilter("time")
  AND entity_id = 'sensor.power_consumed_phase_2'
GROUP BY time_bucket_gapfill('5m', "time")
ORDER BY 1

What I learnt from this exercise is that locf is carrying forward the value of the previous time bucket and not actually the value of the last known sensor value. Maybe its just me, but the naming is a bit misleading?

EDIT: You may also want to have a look at this. You are currently calculating the arithmetic mean for every time bucket which may be misleading if the samples are unevenly spaced.

Interestingly, in this version without LOCF and with COALESCE 0.0, the result becomes 1-to-1 identical to the earlier $__timeGroup example with LOCF. Not sure how that works, but unfortunately I still believe that data to not be correct. Hereā€™s another shot of it compared to the raw data and the ā€œawfulā€ but accurate workaround (ā€œfreol 2ā€ and ā€œtimeGroupā€ being identical):

Seems like time_weight() might indeed be the solution, unfortunately I do not have a way to test it.
The time weighted average functions are part of a separate Timescale Toolkit extension.
I got this setup running in Docker (well, Podman) on an anemic Pi2B, and unfortunately the current TimescaleDB container image that includes Timescale Toolkit does not support multiarch like the old, deprecated image it was supposed to replace, so Iā€™m stuck on that image.
Iā€™ve opened an issue about this back in May, but unfortunately it does not appear to be a priority for them at this time.

I might see if I can install it manually at some point, but everything on this Pi takes forever and Iā€™m glad I even got this compose stack working, so Iā€™ll probably just have to settle for my ā€œawfulā€ solution I guess.
Thanks for your help, if you have any other solutions Iā€™ll be happy to try, if not, at least my awful workaround should do the job, hopefully without running my Pi out of memory.

EDIT: To clarify, I had changed the bucketing to 1m instead of 5m in this screenshot, for better clarity of the issue. Same issue applies to 5m and other intervals of course.

Yeah I tried playing with gapfill etc with my MQTT Eventstream-setup as well. It doesnā€™t really work when the last data point is outside of the query time window. It also doesnā€™t work well with time windows including future times - future energy pricing, prognosis data combined with data from sensors results in faked values until end of graph (maybe thereā€™s functionality for this in TS, havenā€™t looked in to it because of scenario 1 wonā€™t work anyways).

But OK, just reacting to events, like MQTT Eventstream. Follow up question then: I wonder if I can use a similar workaround with LTSS. What I did was to create an appdaemon app that uses the mqtt publish service to publish sensor values on an interval.
Is there some service or event I could trigger like that to make LTSS log a data point? Perhaps manually triggering a sensor update event could work? But a cleaner trigger would be nicer.