DB size suddenly increasing ~250mb a day in the last week.....was previously stable (in postgres)

So after trying a manual recorder.purge last weekend without having any apparent effect, my DB has suddenly increased roughly ~1.2gb in the last week (growth looks to be ~250mb a day). This seems wrong since my db has been relatively stable for months and months at roughly 2.4gb. Am using postgres for db. Any ideas of what I should consider next or where to look? . Have already tried the recorder integration page and I checked recent recorder.yaml settings of other ppl’s personal repo’s on github. I didn’t see an obvious differences between those and mine. For reference, here’s what I have my recorder.yaml

db_url: !secret postgres_db_url
purge_keep_days: 14
exclude:
	domains:
		- updater
		- etc...
	entities:
		- binary\_sensor.attic\_sensor\_acceleration
		- etc...

Thanks.

Scroll down to, 2. Good-enough approach in this to see some SQL queries you can run to see what is causing the most data:

Thank you. Just what I was hoping to be pointed towards. I will have a detailed look at that later this evening.

But in general most probably the reason is that you add some sensors that generates a lot of data (like CPU usage) - value changes at every measure - so a lot of records into the DB. And as the DB is not into the best format - it grows like a hell.

I considered that case with new sensors but that doesn’t seem to be it. Ironically, I do have a lot of cpu & memory related sensors that were not in my exclude list, so I have now added those.

Bigger picture, I didn’t seem to have this runaway growth issue until I tried a manual recorder.purge service call last weekend. This may be an incorrect correlation on my part so my main question is what is the expected outcome after running that process manually? I would have thought a decrease in db size, but including repack:true and changing the keep_days value doesn’t seem to have any noticeable impact.

Definitely a decrease in size. Especially if you set repack: true. This can be quite an intensive operation for large databases though.

Seems like you have a very chatty entity somewhere in there. Did you have any luck with the SQL queries?

For the states table yes, but not on the events table. However, db size growth seems to be flattening since I updated the exclusion list so I’ll give this a bit more time to confirm.

chrome_AohBhoPJES

That’s still quite enormous. What do you have purge_keep_days set to (10 days is the default if you have not set it)?

purge_keep_days is set to 14, so pretty tame I would say. 1.5gb of that size has been the runaway growth over the last week (there was a very slow creep prior to that…prob due to new sensors). Per my last post that seems to have abated but I don’t understand why it started in the first place. None of the sensors I added to the exclude list (which seems to have stopped growth) were new in the last 6+ months. Perhaps related to all of this is I don’t know why I can’t seem to shrink the db any. If that’s the purpose of recorder.purge it doesn’t seem to be working on my instance.

This appears to be related https://github.com/home-assistant/core/issues/41760 but also implies it should be working now?

You might try and dig a bit deeper, this may help you discover where the size issues are at a more granular level.

Just seeing the meta number of your database size growing is enough info I think to diagnose.

Below are a couple things you could try and run over a couple days and see it give you a better view. Maybe a grow in one or more will point out the cause. Start with 1st item below, be comfortable with understanding how many events and states you are adding per day.

Then the second set of queries, make sure you HA purge is really running each night. You can turn on the debug logging for recorder as well and perhaps it will give additional info, if the recorder is not doing the purge. Then beyond that, below a couple of queries that will give you a more granular sense if a table or index is growing.
in configuration.yaml:

logger:
  default: warning
  logs:
    homeassistant.components.recorder: debug

I keep 60+ days in Postgresql, I’ve not found a need to use the HA’s ‘repack’ option in recorder, I’m not really sure what it would do. Postgresql has some pretty good automatic clean ups that run without you having to do anything. HA is really not doing much hard stuff in the database, just adding records and the end of states and events, and with purge deleting them from the other end, not something that such cause wasted space in Postgresql :

# database
recorder:
    purge_keep_days: 65
    db_url: !secret postgres_url
    auto_purge: true

I would start by installing a SQL query tool and getting it attached to your postgresql server.

The command line psql is solid if you are okay with command line. I use this, but I also use TablePlus, a nice free GUI query tool that runs on many platforms. I use on MacOS all the time against my Postgresql 12.3 server running on Ubuntu 20.04 in docker next to my Home Assistant instance running in docker on same Ubuntu machine.

https://tableplus.com/
  1. Find out how many records are being added to your Home Assistant database during time intervals, here is and example of the number of records being added to my Home Assistant database per hour over the last three days. You probably want a number considerably smaller than mine :wink:
SELECT
    date_trunc('hour', last_updated),
    count(1)
FROM
    states
WHERE
    last_updated > now() - interval '3 day'
GROUP BY
    1
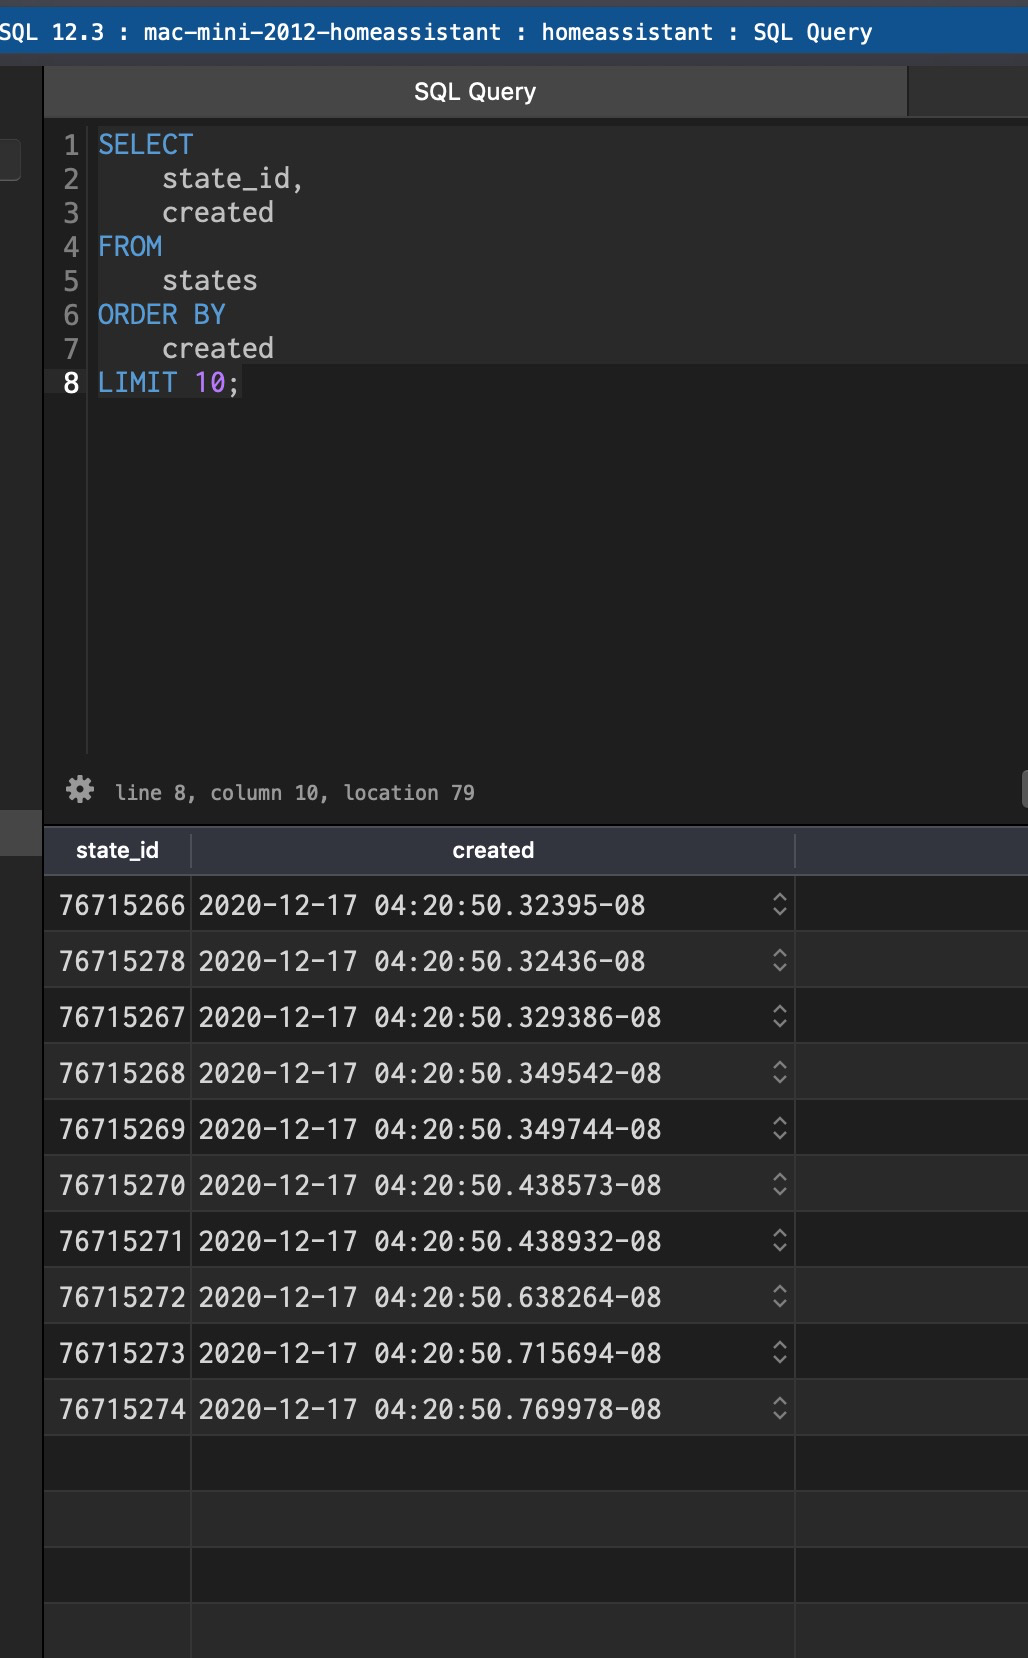
  1. Check the oldest records in your states and events tables to make sure the recorder purge is occurring as you have it setup.
SELECT
    event_id,
    created
FROM
    events
ORDER BY
    created
LIMIT 10;
SELECT
    state_id,
    created
FROM
    states
ORDER BY
    created
LIMIT 10;
  1. Find the size of your Home Assistant tables:
SELECT nspname || '.' || relname AS "relation",
    pg_size_pretty(pg_total_relation_size(C.oid)) AS "total_size"
  FROM pg_class C
  LEFT JOIN pg_namespace N ON (N.oid = C.relnamespace)
  WHERE nspname NOT IN ('pg_catalog', 'information_schema')
    AND C.relkind <> 'i'
    AND nspname !~ '^pg_toast'
  ORDER BY pg_total_relation_size(C.oid) DESC
  LIMIT 5;
  1. Find the size of indexes of your Home Assistant tables:
SELECT
    relname,
    indexrelname,
    idx_scan,
    idx_tup_read,
    idx_tup_fetch,
    pg_size_pretty(pg_relation_size(indexrelname::regclass)) as size
FROM
    pg_stat_all_indexes
WHERE
    schemaname = 'public'
    AND indexrelname NOT LIKE 'pg_toast_%'
    AND idx_scan = 0
    AND idx_tup_read = 0
    AND idx_tup_fetch = 0
ORDER BY
    pg_relation_size(indexrelname::regclass) DESC;


1 Like

@dproffer, thank you for all the great detail! Very Helpful.

I’ve apparently missed the logger integration and have since added.

SQL queries - what I’ve been able to determine:
Query 2 - Purge worked, event & state data only goes back 3 days (my setting is 14 days but I probably performed it manually using 3 days so that should grow until 14 days in reached).

Query 1 - hourly record addition was averaging 12.8K prior to adding several container cpu & memory related entities to the recorder exclusion list. Post exclusion list update hourly records have averaged 9.7k.

Query 3 - Current table sizes:
states: 2.2gb
events: 1.7gb

Query 4 - Table index size
ix_events_event_type_time_fired - 364mb
ix_events_context_id - 326mb
ix_states_old_state_id - 183mb
ix_events_context_user_id - 135mb
ix_events_context_parent_id - 135mb
ix_states_event_id - 111mb

Interpretation of results
Admittedly I am still working through this. Seems like index tables suffer from bloat and I’ll need to perform a vacuum? I thought this is what repack initiated under recorder.purge…so I guess I’ll look to see if I can determine if this has been recently performed.

Reported DB size hasn’t changed since I updated the exclusion list yesterday:
dbsize
However, per query 1, I can see the hourly additions since then. Normally, I would assume data would be purged based on the retention period (purge_keep_days). I did a manual purge using 3 days but my config.yaml setting is 14days so size should be growing again (all things being equal). Should I assume then that 1) I do indeed have bloat and 2) I am not now seeing db growth b/c it is eating into the bloat? Or…maybe I just have it all wrong, lol.

I’m far from a postgresql expert, so do look out in google-land as their is good expertise on postgresql. One of the reasons I picked it for my database.

I would record the deltas of the metrics over several periods, seems the best way to detect if perhaps one of the values seems to grow out of ‘norms’. If you can take your database off line and do the postgresql vacuum and other index clean up functions that would seem the best way (other than deleting db and starting fresh) to remove any ‘air’ in database. I’ve never had to do such, for 65 days if I remove my non HA stuff it is about 100 GB, back of envelope. But I am pretty sure it has been stable at this size for 6 months, not a big window for check, but about twice my ‘keep size’ of 65 days.

There was some issues with some constraints and indexes being incorrectly created/updated around v 119 of HA, I think they have fixed all of these issue now. But I think some folks had some non-deleting issues similar to yours around this time. Another reason to check your database with some of the above queries every now and then.

I do like to use postgresql queries to extract the ‘build template’ of my HA database. When a new version of HA is released and the update starts doing some database reorg type work, I am bit on edge. So you can do these template extracts before and after to see the changes with a diff.

Good hunting!

Yes, I’ll monitor it for a bit then look into postgres methods to cleanup bloat. Wiping it would of course save time now, but is probably just kicking the can and it would eventually come back.

Thanks for all the input!. Good to know you can run yours with a db that large. I guess it is not a surprise that performance is more than just size … so there’s that query route too…