Probably I’m missing something. This perfectly works, but do I really need to refresh the browser page to see the timescale changing?
Personally I do not have to reload at all. The graphs update whenever i choose a different time span.
However, make sure that you have included the entities: part in your card configuration, as It seems that it’s needed in order for the config-template-card to watch for changes on the input_select and update accordingly.
  - type: 'custom:config-template-card'
    variables:
      - 'states[''input_select.hours_to_show''].state'
      - 'states[''input_select.sensors_to_show''].state'
    entities:
      - input_select.hours_to_show
      - input_select.sensors_to_show
Nice! thank you!
awesome!! thank you
Thanks for sharing this. Excellent feature. Just out of interest, can you embed the ‘${vars[0]}’ variable in a history graph title, e.g. title: Rain Last ‘${vars[0]}’ hrs (does not work)
Change your yaml to the following:
    type: 'custom:config-template-card'
    entities:
      - input_select.hours_to_show
    variables:
      hours: "states['input_select.hours_to_show'].state"
      title: "'Rain Last '+states['input_select.hours_to_show'].state+' Hours'"
    card:
      type: history-graph
      hours_to_show: '${hours}'
      title: '${title}'
      entities:
           -  .........
 Thanks!
Hmmm, I have to try this.
Could this be used to dynamically select an area to be used in a “custom:auto-entities”-card?
Well, I am using it in an auto-entities card for the time span, like this:
    type: 'custom:config-template-card'
    entities:
      - input_select.hours_to_show
    variables:
      - 'states[''input_select.hours_to_show''].state'
    card:
      type: 'custom:auto-entities'
      card:
        type: history-graph
        hours_to_show: '${vars[0]}'
      filter:
        include:
          - entity_id: /status/
So, probably, if you make an input_select for the area part, you can modify it to your will
It works, but I need to refresh the page to get the area changed after selecting in the input_select
type: vertical-stack
cards:
  - type: entities
    entities:
      - entity: input_select.area
  - type: 'custom:config-template-card'
    entities:
      - input_select.area
    variables:
      - 'states[''input_select.area''].state'
    card:
      type: 'custom:auto-entities'
      card:
        type: entities
      filter:
        include:
          - area: '${vars[0]}'
I’ve tried to make a test example, and this is how it works for me:

Ah, got it working, perfect!
I had my area selection in a separate entity card and I had referenced to that input_select under ‘variable’ but not the entity part of the ‘custom:config-template-card’.
This is pretty cool, thank you 
Is there any way of making it show calendar days rather than hours?
I often find it useful not to see the last 72 hours but rather “today”, “yesterday” and two days ago, so 3 calendar days. This gives a nicer info on repeating events.
Sure you can @AleXSR7001 , but you will have to use the apex-charts card
Create a new input_select, for example
input_select:
  days_back_card:
    name: Days back
    options:
      - 1
      - 2
      - 3
      - 4
      - 5
      - 6
    initial: 1
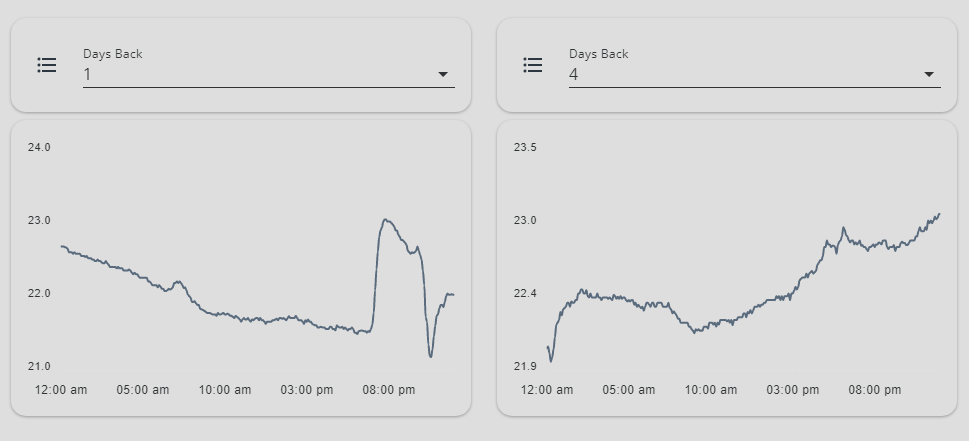
And here’s the code:
type: vertical-stack
cards:
  - type: entities
    entities:
      - entity: input_select.days_back_card
        name: Days Back
  - type: custom:config-template-card
    entities:
      - input_select.days_back_card
    variables:
      days: |
        -states['input_select.days_back_card'].state+'d'
### mind the minus (-), since we want to go back in time ###
    card:
      type: custom:apexcharts-card
      graph_span: 24h
      span:
        start: day
        offset: ${days}
      series:
        - entity: sensor.home_temperature
          stroke_width: 2
          group_by:
            func: median
            duration: 5min
Thank you @valvex !
Out of curiosity, why does this require a different card? Because config-template-card does not support time spans?
I don’t quite know what the difference between the two cards is yet but I will try out ApexCharts and your config code 
So, I got it to work as you suggested. Awesome, thank you!
Unfortunately, I am missing something when trying to combine days_back_to_show with the sensors_to_show from above:
type: vertical-stack
cards:
  - type: entities
    entities:
      - entity: input_select.days_back_to_show
        name: Select Days to go back
  - type: entities
    entities:
      - entity: input_select.sensors_to_show
        name: Select Sensor
  - type: custom:config-template-card
    variables:
      - states['input_select.days_back_to_show'].state
      - states['input_select.sensors_to_show'].state
    entities:
      - input_select.days_back_to_show
      - input_select.sensors_to_show
    card:
      type: custom:apexcharts-card
      graph_span: 24h
      span:
        start: day
        offset: ${days}
      series:
        - entity: ${vars[1]}
          stroke_width: 2
          group_by:
            func: median
            duration: 1min
I think I am calling the sensor variable incorrectly but I am not sure how to fix it. I get both dropdowns (days & sensor) but no graph.
By the way, is it actually possible to use the sensors_to_show as a multiple choice dropdown or is this out of the possibilities of the code?
You have not defined your variables correctly. Here’s the correct code:
type: vertical-stack
cards:
  - type: entities
    entities:
      - entity: input_select.days_back_card
        name: Days Back
      - entity: input_select.sensors_to_show
        name: Select Sensor
  - type: custom:config-template-card
    entities:
      - input_select.days_back_card
      - input_select.sensors_to_show
    variables:
      sensor: states['input_select.sensors_to_show'].state
      days: |
        -states['input_select.days_back_card'].state+'d'
    card:
      type: custom:apexcharts-card
      graph_span: 24h
      span:
        start: day
        offset: ${days}
      series:
        - entity: ${sensor}
          stroke_width: 2
          group_by:
            func: median
            duration: 5min
Ahhhh, now I see!
Thank you again!
I only just realized that “days_back” can be misunderstood. 
As is, it isn’t showing the number of days including today. So if you select 1, it should show today. If you select 2, it should be today and yesterday. Played around but did not manage to get it working. I would have thought that the offset would need to be 0 to display the current day. But maybe that is not as easy as in this case the graph_span would show time in the future with no data (which would be the correct way to display it, but maybe causes a code error?).
So I am guessing that the “offset” would need to be conditional?
I am not really sure, since I am not using it myself.
Have a look at the apex chart card documentation to find out more information regarding the offset option.
I looked at the start, end and offsetoptions before posting and I did not see anything useful. But I think that the approach might need to be changed. Rather than using just the offset, maybe one needs to adjust the graph_span also?
So I think it has to be
    card:
      type: custom:apexcharts-card
      graph_span: ${days}
      span:
        start: day
        offset: 1-${days}
But my offset syntax is wrong. Sorry, I am still not quite familiar with the templating syntax used by HA and find it quite counter-intuitive 
P.S.: I did test it, btw, and the approach works. Just the offset syntax needs fixing
