I’m using excatly this SolCast Solar Integration approach and together with Tibber/EPEX Spot price data I can easyly construct required input lists for MPC optimazations.
Hi, I just ran the optimisation with the same weight value of 0,15 as you and without the weight value:
Without weight value I get this:

And with weight values:

Thinking what the best option is here. Seems the second option is the better one cost_fun_profit is higher
Is there a way to try to quantify the minimum spread (weight_battery_discharge) that would make battery discharge better than using grid power?
Thanks
Doesnt like that either still moans about being infeasable.
2024-06-06 09:13:59,255 - web_server - INFO - Passed runtime parameters: {'load_cost_forecast': [0.15, 0.19, 0.22, 0.43, 0.37, 0.69, 0.68, 0.73, 0.73, 0.68, 0.71, 0.8, 0.75, 0.5, 0.57, 0.48, 0.36, 0.36, 0.36, 0.36, 0.31, 0.27, 0.44, 0.39, 0.36, 0.32, 0.27, 0.26, 0.26, 0.26, 0.29, 0.3, 0.36, 0.59, 0.82, 0.46, 0.4, 0.23, 0.22, 0.13, 0.12, 0.14, 0.09, 0.09, 0.09, 0.09, 0.09, 0.14], 'prod_price_forecast': [0.05, 0.09, 0.11, 0.26, 0.2, 0.28, 0.27, 0.32, 0.32, 0.27, 0.3, 0.39, 0.34, 0.32, 0.38, 0.3, 0.19, 0.19, 0.19, 0.19, 0.15, 0.11, 0.26, 0.22, 0.19, 0.15, 0.11, 0.1, 0.1, 0.1, 0.13, 0.14, 0.19, 0.4, 0.61, 0.28, 0.23, 0.08, 0.06, 0.03, 0.03, 0.04, -0.0, -0.0, -0.0, -0.0, -0.0, 0.05], 'pv_power_forecast': [0.9197, 0.3969, 0.7298, 0.5452, 0.2939, 0.0066, 0, 0, 0, 0, 0, 0, 0, 0, 0, 0, 0, 0, 0, 0, 0, 0, 0, 0, 0, 0, 0, 0, 0, 0, 0, 0, 0, 0.0492, 1.6617, 3.1556, 4.4012, 5.5342, 6.3928, 7.0159, 7.6574, 7.9615, 8.0619, 7.7789, 7.1398, 6.4503, 5.6678, 4.9008, 4.0576], 'prediction_horizon': 24, 'soc_init': 1.0, 'soc_final': 0.2, 'def_total_hours': [24], 'def_load_start': [0], 'def_load_end': [96]}
2024-06-06 09:13:59,255 - web_server - INFO -  >> Setting input data dict
2024-06-06 09:13:59,255 - web_server - INFO - Setting up needed data
2024-06-06 09:13:59,257 - web_server - INFO - Retrieve hass get data method initiated...
2024-06-06 09:13:59,721 - web_server - INFO - Retrieving weather forecast data using method = list
2024-06-06 09:13:59,721 - web_server - INFO - Retrieving data from hass for load forecast using method = naive
2024-06-06 09:13:59,722 - web_server - INFO - Retrieve hass get data method initiated...
2024-06-06 09:14:00,086 - web_server - INFO -  >> Performing naive MPC optimization...
2024-06-06 09:14:00,086 - web_server - INFO - Performing naive MPC optimization
2024-06-06 09:14:00,093 - web_server - INFO - Perform an iteration of a naive MPC controller
2024-06-06 09:14:00,097 - web_server - DEBUG - Deferrable load 0: Proposed optimization window: 0 --> 0
2024-06-06 09:14:00,097 - web_server - DEBUG - Deferrable load 0: Validated optimization window: 0 --> 0
2024-06-06 09:14:00,107 - web_server - WARNING - Solver default unknown, using default
Welcome to the CBC MILP Solver
Version: 2.10.3
Build Date: Dec 15 2019

command line - /usr/local/lib/python3.11/dist-packages/pulp/solverdir/cbc/linux/64/cbc /tmp/3d3303b2adf443c8b20e06d3baf5886a-pulp.mps -max -timeMode elapsed -branch -printingOptions all -solution /tmp/3d3303b2adf443c8b20e06d3baf5886a-pulp.sol (default strategy 1)
At line 2 NAME          MODEL
At line 3 ROWS
At line 435 COLUMNS
At line 2778 RHS
At line 3209 BOUNDS
At line 3498 ENDATA
Problem MODEL has 430 rows, 264 columns and 2030 elements
Coin0008I MODEL read with 0 errors
Option for timeMode changed from cpu to elapsed
Problem is infeasible - 0.00 seconds
Option for printingOptions changed from normal to all
Total time (CPU seconds):       0.00   (Wallclock seconds):       0.01

2024-06-06 09:14:00,122 - web_server - INFO - Status: Infeasible
2024-06-06 09:14:00,122 - web_server - INFO - Total value of the Cost function = -30.49
Try reducing def_load_end to 0.
I just used their example and created a automation to run the solcast update 10 times a day
alias: Solcast update
description: ""
trigger:
  - platform: template
    value_template: >-
      {% set nr = as_datetime(state_attr('sun.sun','next_rising')) | as_local %}
      {% set ns = as_datetime(state_attr('sun.sun','next_setting')) | as_local %}
      {% set api_request_limit = 10 %}
      {% if nr > ns %}
        {% set nr = nr - timedelta(hours = 24) %}
      {% endif %}
      {% set hours_difference = (ns - nr) %}
      {% set interval_hours = hours_difference / api_request_limit %}
      {% set ns = namespace(match = false) %}
      {% for i in range(api_request_limit) %}
        {% set start_time = nr + (i * interval_hours) %}
        {% if ((start_time - timedelta(seconds=30)) <= now()) and (now() <= (start_time + timedelta(seconds=30))) %}
          {% set ns.match = true %}
        {% endif %}
      {% endfor %}
      {{ ns.match }}
condition:
  - condition: sun
    before: sunset
    after: sunrise
action:
  - delay:
      seconds: "{{ range(30, 360)|random|int }}"
  - service: solcast_solar.update_forecasts
    data: {}
mode: single
Then its just a matter of using what is stored in
sensor.solcast_pv_forecast_forecast_today
and
sensor.solcast_pv_forecast_forecast_tomorrow
The mpc-optim looks like
       "pv_power_forecast": {{
        ([states('sensor.total_pv_ac')|int(0)] +
        state_attr('sensor.solcast_pv_forecast_forecast_today', 'detailedForecast')|selectattr('period_start','gt',utcnow()) | map(attribute='pv_estimate')|map('multiply',1000)|map('int')|list +
        state_attr('sensor.solcast_pv_forecast_forecast_tomorrow', 'detailedForecast')|selectattr('period_start','gt',utcnow()) | map(attribute='pv_estimate')|map('multiply',1000)|map('int')|list)| tojson }},
Mine pmc_optim didn’t like it being True/False but works fine with 1/0 so I’ve updated mine to
"def_current_state": [{{iif(states('sensor.p_deferrable0')|int(0),1,0)}}]
Sorry to hassle you Mark,
Heres the thing, I am not passing that setting I cant see where its coming from, I even tried to force 0 in the MPC call
MPC call
service: shell_command.post_mpc_optim_solcast
data:
  command: |
    curl -i -H "Content-Type: application/json" -X POST -d '{
      "load_cost_forecast": {{ (
        [states('sensor.general_price')|float(0)] +
        state_attr('sensor.general_forecast', 'forecasts')|map(attribute='per_kwh')|list
      )|tojson }},
      "prod_price_forecast": {{ (
        [states('sensor.feed_in_price')|float(0)] +
        state_attr('sensor.feed_in_forecast', 'forecasts')|map(attribute='per_kwh')|list
      )|tojson }},
      "pv_power_forecast": {{ (state_attr('sensor.solcast_24hrs_forecast', 'forecasts')|map(attribute='pv_estimate')|list)|tojson }},
      "prediction_horizon": 48,
      "soc_init": {{ (states('sensor.powerwall_charge')|float(0)) / 100 }},
      "soc_final": 0.05,
      "def_total_hours": [2],
      "def_load_start": [0],
      "def_load_end": [0]
    }' http://localhost:5000/action/naive-mpc-optim
The config
logging_level: DEBUG
data_path: default
costfun: profit
sensor_power_photovoltaics: sensor.solar_energy_v2
sensor_power_load_no_var_loads: sensor.home_load_power
set_total_pv_sell: false
set_nocharge_from_grid: false
set_nodischarge_to_grid: false
maximum_power_from_grid: 35000
maximum_power_to_grid: 15000
number_of_deferrable_loads: 1
list_nominal_power_of_deferrable_loads:
  - nominal_power_of_deferrable_loads: 1800
list_operating_hours_of_each_deferrable_load:
  - operating_hours_of_each_deferrable_load: 2
list_start_timesteps_of_each_deferrable_load:
  - start_timesteps_of_each_deferrable_load: 0
list_end_timesteps_of_each_deferrable_load:
  - end_timesteps_of_each_deferrable_load: 0
list_peak_hours_periods_start_hours:
  - peak_hours_periods_start_hours: "16:54"
list_peak_hours_periods_end_hours:
  - peak_hours_periods_end_hours: "20:54"
list_treat_deferrable_load_as_semi_cont:
  - treat_deferrable_load_as_semi_cont: true
list_set_deferrable_load_single_constant:
  - set_deferrable_load_single_constant: false
load_peak_hours_cost: 0
load_offpeak_hours_cost: 0
photovoltaic_production_sell_price: 0
list_pv_module_model: []
list_pv_inverter_model: []
list_surface_tilt: []
list_surface_azimuth: []
list_modules_per_string: []
list_strings_per_inverter: []
inverter_is_hybrid: false
set_use_battery: true
battery_nominal_energy_capacity: 13500
list_priority_of_deferrable_loads:
  - priority_of_deferrable_loads: 1
optimization_time_step: 15
battery_maximum_state_of_charge: 1
battery_target_state_of_charge: 0.5
battery_discharge_efficiency: 0.9
battery_charge_efficiency: 0.9
battery_charge_power_max: 5000
battery_discharge_power_max: 5000
set_battery_dynamic: true
battery_dynamic_max: 0.7
battery_dynamic_min: -0.7
battery_minimum_state_of_charge: 0.2
solcast_rooftop_id: XXXX
solcast_api_key: XXXX
production_price_forecast_method: constant
load_forecast_method: naive
weather_forecast_method: solcast
prediction_horizon: 48
method_ts_round: first
weight_battery_discharge: 0.2
weight_battery_charge: 0
but the log still shows 96

Just to add, here is the template output of my MPC call
service: shell_command.post_mpc_optim_solcast
data:
command: >
post_mpc_optim_solcast: “curl -i -H "Content-Type: application/json" -X POST -d ‘{"load_cost_forecast":[0.45, 0.66, 0.59, 0.59, 0.59, 0.59, 0.59, 0.59, 0.58, 0.31, 0.33, 0.33, 0.32, 0.31, 0.29, 0.28, 0.28, 0.27, 0.27, 0.26, 0.26, 0.26, 0.25, 0.26, 0.26, 0.26, 0.36, 0.43, 0.57, 0.61, 1.37, 0.61, 0.52, 0.61, 1.37, 0.55, 12.14, 1.3, 0.29, 0.27, 0.17, 0.17, 0.17, 0.22, 0.13, 0.14, 0.19, 0.36], "prod_price_forecast":[0.27, 0.25, 0.19, 0.19, 0.19, 0.19, 0.19, 0.19, 0.18, 0.15, 0.17, 0.17, 0.15, 0.14, 0.13, 0.12, 0.11, 0.11, 0.1, 0.1, 0.1, 0.1, 0.09, 0.1, 0.1, 0.1, 0.19, 0.25, 0.38, 0.42, 1.11, 0.42, 0.33, 0.42, 1.11, 0.41, 10.95, 1.1, 0.18, 0.16, 0.07, 0.07, 0.07, 0.11, 0.03, 0.04, 0.09, 0.19], "pv_power_forecast":[1513, 497, 465, 0, 0, 0, 0, 0, 0, 0, 0, 0, 0, 0, 0, 0, 0, 0, 0, 0, 0, 0, 0, 0, 0, 0, 0, 0, 0, 0, 0, 6, 393, 1500, 2779, 3824, 4636, 5335, 5905, 6310, 6624, 6800, 6511, 5842, 5144, 4333, 3522, 2631], "prediction_horizon":48,"soc_init":0.88,"soc_final":0.05,"def_total_hours":[2]}’ http://localhost:5000/action/naive-mpc-optim”
But in the logs the values are all different for example the SOC init is a different value
IndexError: list index out of range
2024-06-06 16:48:34,189 - web_server - INFO - Passed runtime parameters: {‘load_cost_forecast’: [0.15, 0.19, 0.22, 0.43, 0.37, 0.69, 0.68, 0.73, 0.73, 0.68, 0.71, 0.8, 0.75, 0.5, 0.57, 0.48, 0.36, 0.36, 0.36, 0.36, 0.31, 0.27, 0.44, 0.39, 0.36, 0.32, 0.27, 0.26, 0.26, 0.26, 0.29, 0.3, 0.36, 0.59, 0.82, 0.46, 0.4, 0.23, 0.22, 0.13, 0.12, 0.14, 0.09, 0.09, 0.09, 0.09, 0.09, 0.14], ‘prod_price_forecast’: [0.05, 0.09, 0.11, 0.26, 0.2, 0.28, 0.27, 0.32, 0.32, 0.27, 0.3, 0.39, 0.34, 0.32, 0.38, 0.3, 0.19, 0.19, 0.19, 0.19, 0.15, 0.11, 0.26, 0.22, 0.19, 0.15, 0.11, 0.1, 0.1, 0.1, 0.13, 0.14, 0.19, 0.4, 0.61, 0.28, 0.23, 0.08, 0.06, 0.03, 0.03, 0.04, -0.0, -0.0, -0.0, -0.0, -0.0, 0.05], ‘pv_power_forecast’: [0.9197, 0.3969, 0.7298, 0.5452, 0.2939, 0.0066, 0, 0, 0, 0, 0, 0, 0, 0, 0, 0, 0, 0, 0, 0, 0, 0, 0, 0, 0, 0, 0, 0, 0, 0, 0, 0, 0, 0.0492, 1.6617, 3.1556, 4.4012, 5.5342, 6.3928, 7.0159, 7.6574, 7.9615, 8.0619, 7.7789, 7.1398, 6.4503, 5.6678, 4.9008, 4.0576], ‘prediction_horizon’: 24, 'soc_init’: 1.0, ‘soc_final’: 0.2, ‘def_total_hours’: [24], ‘def_load_start’: [0], ‘def_load_end’: [96]}
I reinstalled EMHASS back into HA so its the default config, so I have no battery settings defined, I have no idea where these settings came from, I didnt define them


try to change this to optimization_time_step: 30
Still the same strange issue the data I am passing using curl is different to what ends up in the logs, im using the amber + solcast call thats in the documentation

Try to change your datapath to share.
Or have a look in your share folder and remove all .pkl files
Where does this come from? I can’t find anything about this in the docs.
i removed that, found on a forum.
setting it to share and deleting the files made no difference.
still random entries that dont align with the curl command
logging_level: DEBUG
data_path: /share/
costfun: profit
sensor_power_photovoltaics: sensor.solar_energy_v2
sensor_power_load_no_var_loads: sensor.home_load_power
set_total_pv_sell: false
set_nocharge_from_grid: false
set_nodischarge_to_grid: false
maximum_power_from_grid: 35000
maximum_power_to_grid: 15000
number_of_deferrable_loads: 1
list_nominal_power_of_deferrable_loads:
  - nominal_power_of_deferrable_loads: 1800
list_operating_hours_of_each_deferrable_load:
  - operating_hours_of_each_deferrable_load: 2
list_start_timesteps_of_each_deferrable_load:
  - start_timesteps_of_each_deferrable_load: 0
list_end_timesteps_of_each_deferrable_load:
  - end_timesteps_of_each_deferrable_load: 0
list_peak_hours_periods_start_hours:
  - peak_hours_periods_start_hours: "16:54"
list_peak_hours_periods_end_hours:
  - peak_hours_periods_end_hours: "20:54"
list_treat_deferrable_load_as_semi_cont:
  - treat_deferrable_load_as_semi_cont: true
list_set_deferrable_load_single_constant:
  - set_deferrable_load_single_constant: false
load_peak_hours_cost: 0
load_offpeak_hours_cost: 0
photovoltaic_production_sell_price: 0
list_pv_module_model: []
list_pv_inverter_model: []
list_surface_tilt: []
list_surface_azimuth: []
list_modules_per_string: []
list_strings_per_inverter: []
inverter_is_hybrid: false
set_use_battery: true
battery_nominal_energy_capacity: 13500
optimization_time_step: 30
battery_maximum_state_of_charge: 0.9
battery_target_state_of_charge: 0.6
battery_discharge_efficiency: 0.9
battery_charge_efficiency: 0.9
battery_charge_power_max: 5000
battery_discharge_power_max: 5000
set_battery_dynamic: true
battery_dynamic_max: 0.9
battery_dynamic_min: -0.9
battery_minimum_state_of_charge: 0.2
solcast_rooftop_id: XXXX
solcast_api_key: XXXX
production_price_forecast_method: constant
load_forecast_method: naive
weather_forecast_method: solcast
prediction_horizon: 48
method_ts_round: first
weight_battery_discharge: 0.2
weight_battery_charge: 0
None of these numbers are correct when compared to the sensors in HA, no idea where they are referenced from
waitress INFO Serving on http://0.0.0.0:5000
2024-06-06 17:20:30,260 - web_server - INFO - Passed runtime parameters: {‘load_cost_forecast’: [0.15, 0.19, 0.22, 0.43, 0.37, 0.69, 0.68, 0.73, 0.73, 0.68, 0.71, 0.8, 0.75, 0.5, 0.57, 0.48, 0.36, 0.36, 0.36, 0.36, 0.31, 0.27, 0.44, 0.39, 0.36, 0.32, 0.27, 0.26, 0.26, 0.26, 0.29, 0.3, 0.36, 0.59, 0.82, 0.46, 0.4, 0.23, 0.22, 0.13, 0.12, 0.14, 0.09, 0.09, 0.09, 0.09, 0.09, 0.14], ‘prod_price_forecast’: [0.05, 0.09, 0.11, 0.26, 0.2, 0.28, 0.27, 0.32, 0.32, 0.27, 0.3, 0.39, 0.34, 0.32, 0.38, 0.3, 0.19, 0.19, 0.19, 0.19, 0.15, 0.11, 0.26, 0.22, 0.19, 0.15, 0.11, 0.1, 0.1, 0.1, 0.13, 0.14, 0.19, 0.4, 0.61, 0.28, 0.23, 0.08, 0.06, 0.03, 0.03, 0.04, -0.0, -0.0, -0.0, -0.0, -0.0, 0.05], ‘pv_power_forecast’: [0.9197, 0.3969, 0.7298, 0.5452, 0.2939, 0.0066, 0, 0, 0, 0, 0, 0, 0, 0, 0, 0, 0, 0, 0, 0, 0, 0, 0, 0, 0, 0, 0, 0, 0, 0, 0, 0, 0, 0.0492, 1.6617, 3.1556, 4.4012, 5.5342, 6.3928, 7.0159, 7.6574, 7.9615, 8.0619, 7.7789, 7.1398, 6.4503, 5.6678, 4.9008, 4.0576], ‘prediction_horizon’: 24, ‘soc_init’: 1.0, ‘soc_final’: 0.2, ‘def_total_hours’: [24], ‘def_load_start’: [0], ‘def_load_end’: [96]}
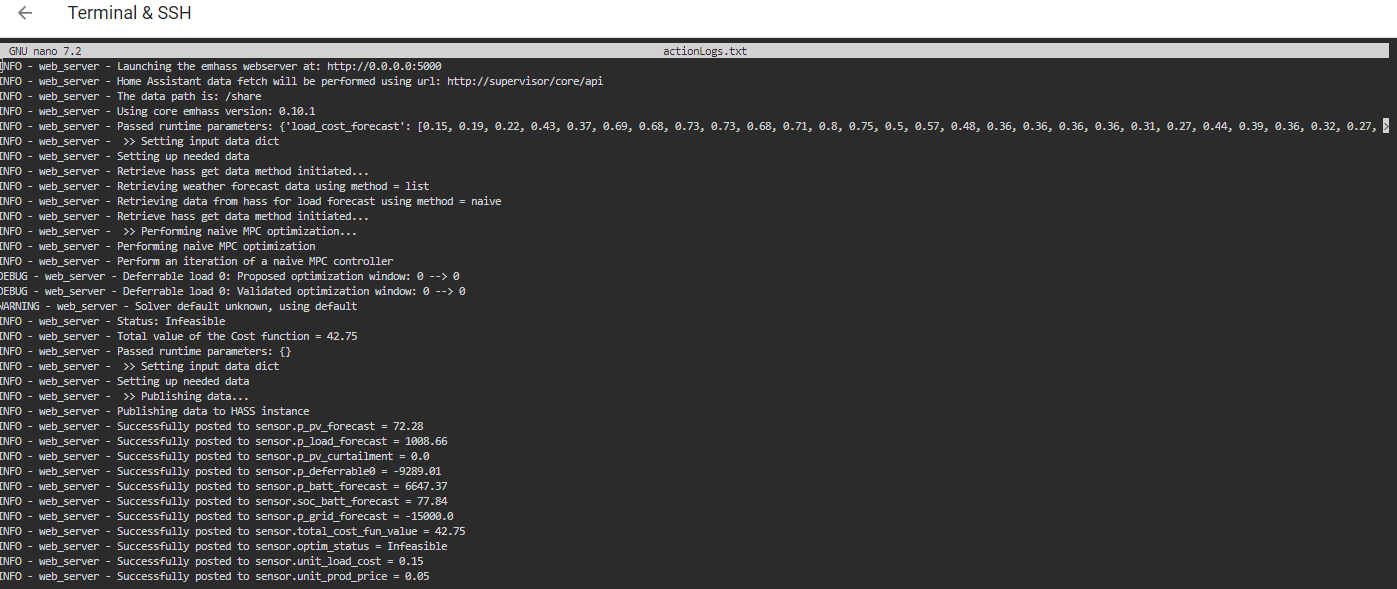
Can you post the actionLogs.txt file
Sorry about the image, the terminal addon wont let me cut and paste
Template data, you can see the soc_init has changed it was at 88 before now its down to 84

Try to define a rest command in HA
post_mpc_optim_solcast:
  url: http://localhost:5000/action/naive-mpc-optim
  method: POST
  content_type: "application/json"
  payload: >-
    {
      "prod_price_forecast": {{ (
        [states('sensor.feed_in_price')|float(0)] +
        state_attr('sensor.feed_in_forecast', 'forecasts')|map(attribute='per_kwh')|list)|tojson
        }},
      "load_cost_forecast": {{ (
        [states('sensor.general_price')|float(0)] +
        state_attr('sensor.general_forecast', 'forecasts')|map(attribute='per_kwh')|list)|tojson
        }},
      "pv_power_forecast": {{ (state_attr('sensor.solcast_24hrs_forecast', 'forecasts')|map(attribute='pv_estimate')|list)|tojson }},
      "prediction_horizon": 48,
      "num_def_loads": 1,
      "p_deferrable_nom": [1800],
      "soc_init": {{ (states('sensor.powerwall_charge')|float(0)) / 100 }},
      "soc_final": 0.05,
      "def_total_hours": [2],
      "def_load_start": [0],
      "def_load_end": [0]
    }
And call this service rest_command.post_mpc_optim_solcast
Excatly the same issue its pulling data that I have not sent.
There seem so to be no logical reason as to why the data posted is different to what Home Assistant sees in the Dev Tools template render
Have also submitted a bug report
2024-06-06 22:49:14,717 - web_server - INFO - Status: Infeasible
2024-06-06 22:49:14,717 - web_server - INFO - Total value of the Cost function = 42.75
2024-06-06 22:49:49,930 - web_server - INFO - Passed runtime parameters: {‘load_cost_forecast’: [0.15, 0.19, 0.22, 0.43, 0.37, 0.69, 0.68, 0.73, 0.73, 0.68, 0.71, 0.8, 0.75, 0.5, 0.57, 0.48, 0.36, 0.36, 0.36, 0.36, 0.31, 0.27, 0.44, 0.39, 0.36, 0.32, 0.27, 0.26, 0.26, 0.26, 0.29, 0.3, 0.36, 0.59, 0.82, 0.46, 0.4, 0.23, 0.22, 0.13, 0.12, 0.14, 0.09, 0.09, 0.09, 0.09, 0.09, 0.14], ‘prod_price_forecast’: [0.05, 0.09, 0.11, 0.26, 0.2, 0.28, 0.27, 0.32, 0.32, 0.27, 0.3, 0.39, 0.34, 0.32, 0.38, 0.3, 0.19, 0.19, 0.19, 0.19, 0.15, 0.11, 0.26, 0.22, 0.19, 0.15, 0.11, 0.1, 0.1, 0.1, 0.13, 0.14, 0.19, 0.4, 0.61, 0.28, 0.23, 0.08, 0.06, 0.03, 0.03, 0.04, -0.0, -0.0, -0.0, -0.0, -0.0, 0.05], ‘pv_power_forecast’: [0.9197, 0.3969, 0.7298, 0.5452, 0.2939, 0.0066, 0, 0, 0, 0, 0, 0, 0, 0, 0, 0, 0, 0, 0, 0, 0, 0, 0, 0, 0, 0, 0, 0, 0, 0, 0, 0, 0, 0.0492, 1.6617, 3.1556, 4.4012, 5.5342, 6.3928, 7.0159, 7.6574, 7.9615, 8.0619, 7.7789, 7.1398, 6.4503, 5.6678, 4.9008, 4.0576], ‘prediction_horizon’: 24, ‘soc_init’: 1.0, ‘soc_final’: 0.2, ‘def_total_hours’: [24], ‘def_load_start’: [0], ‘def_load_end’: [96]}
2024-06-06 22:49:49,930 - web_server - INFO - >> Setting input data dict
2024-06-06 22:49:49,930 - web_server - INFO - Setting up needed data
2024-06-06 22:49:49,932 - web_server - INFO - Retrieve hass get data method initiated…
2024-06-06 22:49:50,349 - web_server - INFO - Retrieving weather forecast data using method = list
2024-06-06 22:49:50,350 - web_server - INFO - Retrieving data from hass for load forecast using method = naive
2024-06-06 22:49:50,350 - web_server - INFO - Retrieve hass get data method initiated…
2024-06-06 22:49:50,666 - web_server - INFO - >> Performing naive MPC optimization…
2024-06-06 22:49:50,666 - web_server - INFO - Performing naive MPC optimization
2024-06-06 22:49:50,676 - web_server - INFO - Perform an iteration of a naive MPC controller
2024-06-06 22:49:50,680 - web_server - DEBUG - Deferrable load 0: Proposed optimization window: 0 → 0
2024-06-06 22:49:50,680 - web_server - DEBUG - Deferrable load 0: Validated optimization window: 0 → 0
2024-06-06 22:49:50,690 - web_server - WARNING - Solver default unknown, using default
Welcome to the CBC MILP Solver
Version: 2.10.3
Build Date: Dec 15 2019
command line - /usr/local/lib/python3.11/dist-packages/pulp/solverdir/cbc/linux/64/cbc /tmp/fcd7bf4929f347429d8815b1d3289a79-pulp.mps -max -timeMode elapsed -branch -printingOptions all -solution /tmp/fcd7bf4929f347429d8815b1d3289a79-pulp.sol (default strategy 1)
At line 2 NAME MODEL
At line 3 ROWS
At line 435 COLUMNS
At line 2778 RHS
At line 3209 BOUNDS
At line 3498 ENDATA
Problem MODEL has 430 rows, 264 columns and 2030 elements
Coin0008I MODEL read with 0 errors
Option for timeMode changed from cpu to elapsed
Problem is infeasible - 0.00 seconds
Option for printingOptions changed from normal to all
Total time (CPU seconds): 0.00 (Wallclock seconds): 0.00
2024-06-06 22:49:50,702 - web_server - INFO - Status: Infeasible
2024-06-06 22:49:50,703 - web_server - INFO - Total value of the Cost function = 42.75
The template info
