Does anyone else discover this kind of display bug in the Devices energy graph?
It occurs sometimes when i open the browser after a day or change size of the browser
tab. After a page refresh or click and drag-down the graph shows up correctly.
Devices energy graph: (type: energy-devices-graph )
You need to use the Total value, not Today value. Today resets daily, which results in a lower than previous value, that generates the starting negative value you are seeing.
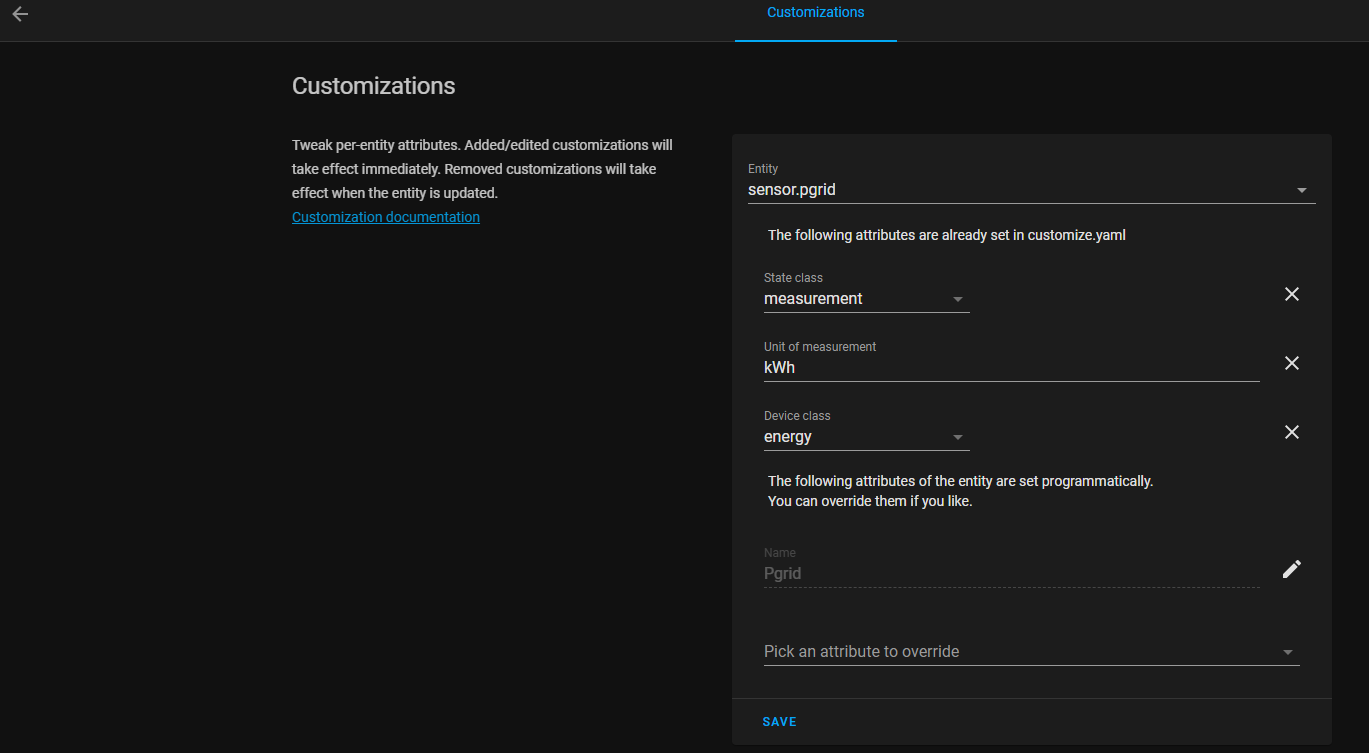
Having issues getting my stats to show in drop down. I get power stats via emoncms. I have overwrite attributes to Unit of measurement to kWh and set state class to measurement?
It has been said many times in this thread and in the 2021.8 release thread, but there are a number of attributes that need to be set. I believe that they are:
state_class: measurement
last_reset: '1970-01-01T00:00:00+00:00'
unit_of_measurement: kWh # or Wh
device_class: energy
Also make sure the entity is measuring energy not power. Power is the rate of consumption of energy. Think of it like this, your heater consumes at the rate of 1.5 kW (power) and in 3 hours uses 4.5 kWh of energy.
‘’’
Thanks so much nickrout! I tried to read though thread must have miss read or understood! I have set device_class to energy. Dont seem to find the last reset but kWh are reset daily. With setting device class to energy still not populating in drop down but will keep trying
‘’
Your a LEGEND, thanks for your time to respond! I added attribute of other, set attribution name to last_reset and attribuite value to ```
1970-01-01T00:00:00+00:00
and now get the drop down in energy!!! Whoop whoop, lets hope it calculates correctly :wink:
Got you! I have changed W to Wh, however, nothing show up again, do I need to restert HA?
UPDATE:
Ok so what you need to do in order for the thing to work: make sure you have Energy kWh measurement in your system, I have it in configuration file.
If you have Power, which is instant measurements, you can change it to kWh, which mend that if you use instant data 1 hr and devide it to 1000 you will have kWh:
Using “Energy Consumption” for the consumption section is obvious, but should I add “Energy Production” to the solar panels, or is the “Return to grid” ? And if so, where do I get the other entities (return to grid, or solar production?)
That’s why I’m not getting anything on my Energy dashboard! But why is it not updating? I’ve gone into my meter config (AEON Labs gen 5 meter) and my kWh reporting is enabled, along with voltage, amps, etc… and those values are definitely updating:
It’s a valid entity… so… what the heck? I’ve just enabled another kWh report from Group 2–there are three reporting groups for this meter–to see if that one will work.
It could be because the energy monitor integration doesn’t display based on the sensor, but on the statistics. You can check the statistics as per my post here:
Hoping for this too. I cobbled together some sensors that read data from RTL-AMR and report usage and cost in a few different ways, but this August update has much more potential.
So I am looking to see if anyone has some ideas on how to handle the setup I have to make it work with the new energy dashboard. I currently collect energy data through a Brultech Greeneye energy monitor which collects energy data on every circuit in my house. The device also has a separate channel that collects the main lines and solar. This system collects data in watt-seconds that is continuously increasing, decreasing in the case of solar. Through a python script it is converted to watt-hours and stored in Influxdb. I am using the influxdb integration to pull this data into home assistant and then use a template sensor to get it into the right format for the energy dashboard to display the data.
This works great for the individual circuits/devices chart. The problem I have is with the grid consumption and the export consumption. Technically my mains line is recording net usage. So I can’t just pipe in the value directly from influxdb. Obviously some math needs to be done, but I am not sure about the best way to do it. I can stumble through writing yaml code and template sensors, just takes me awhile. I imagine the best way to do this is to some sort of intermediate calculation that is then piped into the template sensor for the energy dashboard.
I think I need this logic. Which would produce a watt-hour counter that the dashboard is expecting.
If (main_wh_now - main_wh_15min_ago) > 0 THEN
grid_consumption = (main_wh_now - main_wh_15min_ago) + previous grid_consumption value

If (main_wh_now - main_wh_15min_ago) < 0 THEN
export_grid = (main_wh_15min_ago - main_wh_now) + previous export_grid value
@BillRandolph Same here with rtlamr - but I’m stuck, I think. I’m successfully sending the data to HA via MQTT, which results in a sensor.elec_meter that shows the correct current meter reading.
That’s cool - but my sensor.elec_meter doesn’t show up on the “Grid Consumption” drop down. Do I need to create some other sensor?
@ kr_noob
You need to go into the definition for the sensor or the customization page for it and define a state_class of measurement, a device class of energy, and a last_reset of ‘1970-01-01T00:00:00+00:00’