Do you mean all int to int(0)?
tried but that did not change. Think something to do with name: Grid_…

I also wanted to ask if you can add a snap of your Electricity grid and Solar Panels sensor for the graph
Do you mean all int to int(0)?
tried but that did not change. Think something to do with name: Grid_…
I also wanted to ask if you can add a snap of your Electricity grid and Solar Panels sensor for the graph
I have 3 power sensors.
template:

  - sensor:
        name: Solar Power Corrected
        state_class: measurement
        icon: mdi:solar-panel
        unit_of_measurement: W
        device_class: power
        state: >
            {% set value = states('sensor.envoy_SN_current_power_production') | int(0) %}
            {% if value  <= 5 -%}
              0
            {% elif is_state('sun.sun','below_horizon') %}
              0
            {%- else -%}
              {{ value }}
            {%- endif %}


  - sensor:
        name: Grid Import Power
        state_class: measurement
        icon: mdi:transmission-tower
        unit_of_measurement: W
        device_class: power
        state: >
            {{ [0, states('sensor.envoy_SN_current_power_consumption') | int(0) - states('sensor.solar_power_corrected') | int(0) ] | max }}

  - sensor:
        name: Grid Export Power
        state_class: measurement
        icon: mdi:transmission-tower
        unit_of_measurement: W
        device_class: power
        state: >
            {{ [0, states('sensor.solar_power_corrected') | int(0) - states('sensor.envoy_SN_current_power_consumption') | int(0) ] | max }}
then I have 3 matching integration sensors that record how much energy.
sensor:

  - platform: integration
    name: Solar Energy Corrected
    source: sensor.solar_power_corrected
    method: left
    unit_prefix: k
    unit_time: h


  - platform: integration
    name: Grid Import Energy
    source: sensor.grid_import_power
    method: left
    unit_prefix: k
    unit_time: h

  - platform: integration
    name: Grid Export Energy
    source: sensor.grid_export_power
    method: left
    unit_prefix: k
    unit_time: h
sorry I meant the pic of your
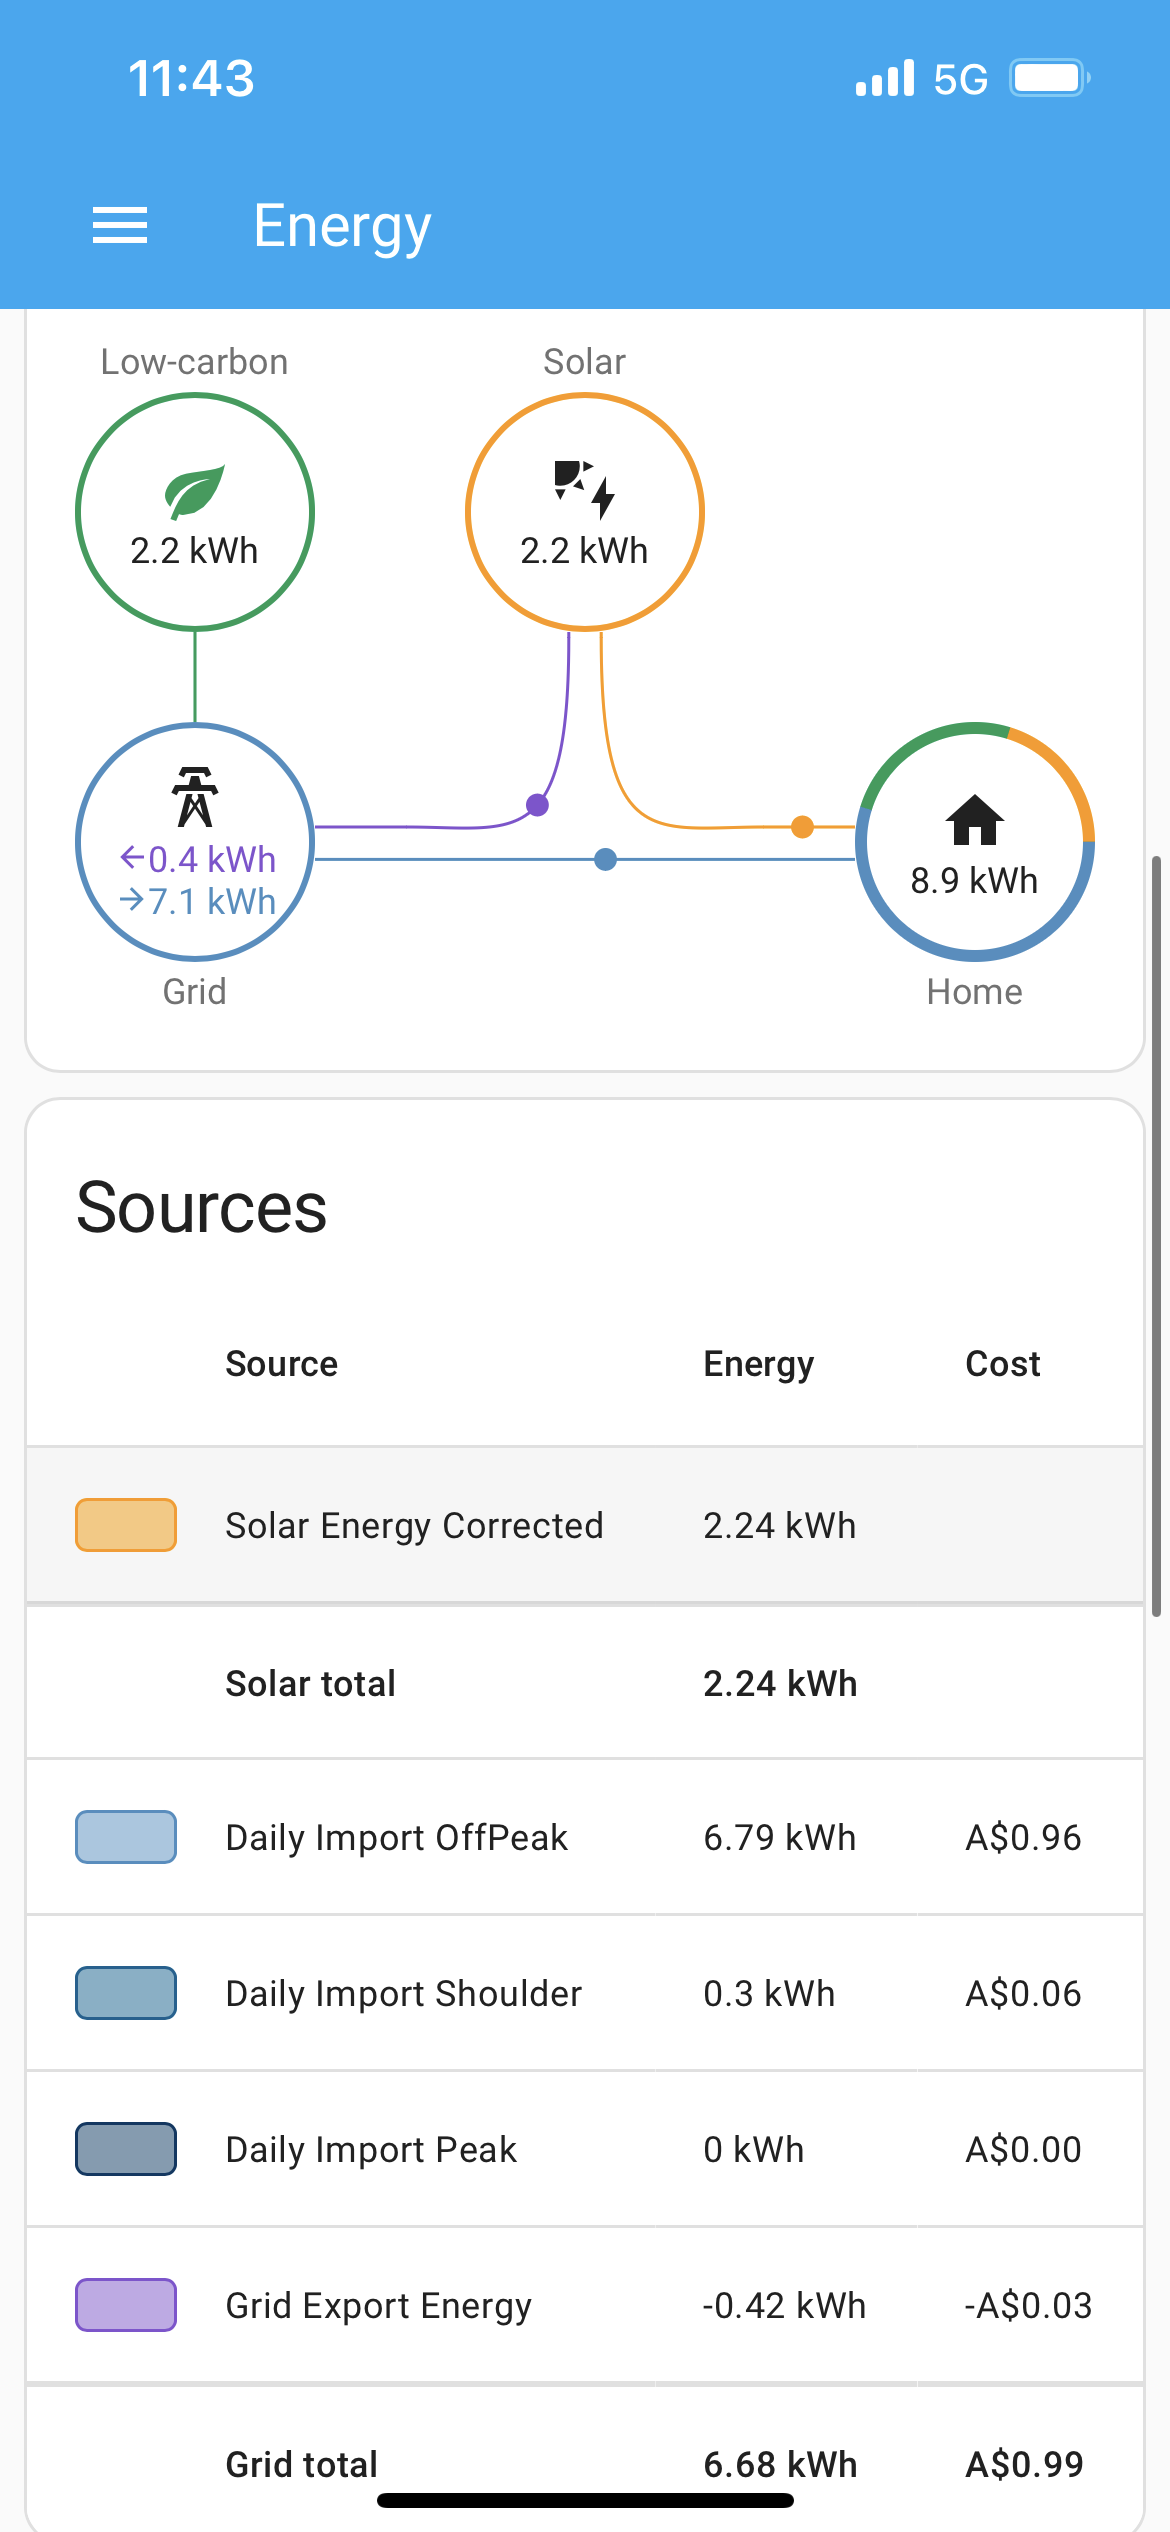
The grid import figure is incorrect if I believe my app
which shows this
Hi,
I asked this question before:
Have the integration/energy sensors been setup less than 24 hours ago?
As for figures.
Enphase enlighten data is updated every 15 minutes.
And home assistant statistics which are used by energy dashboard are computed every hour which means they are delayed by up to an hour.
To get a better idea of accuracy, it’s best to check the daily totals for the day before.
yup setup less than 24 hours
Day before matches for total consumption but day before yesterday it does not. I guess I’ll leave it for a day running and see what is like. I assume the error in the code I should not worry too much since HA checks out ok?
I do want to update the data 5min intervals but dont understand where the code needs updating? Sorry newbee
Basically your post here is hard to understand as to where this edit needs to be made…where am I putting the updated code for the card?
Ah, well behind the scenes, the original power sensors from the envoy are updated every minute. You can see this when looking at the original sensor.
The integration/energy sensors follow the source sensors and update whenever the source sensors are updated.
As for apexcharts that replicate the look of the enphase app, I’ll post my current config yaml here:
To draw the grey area, I had to add a net power sensor:
template:
  - sensor:
      - name: Net Power
        state_class: measurement
        unit_of_measurement: W
        device_class: power
        icon: mdi:transmission-tower
        state: >
          {% set production = states('sensor.solar_power_corrected') | int(0) %}
          {% set consumption = states('sensor.envoy_SN_current_power_consumption') | int(0) %}
          {{ (production - consumption) }}
Then in the edit dashboard, add card, custom: apex cards chart, card config section of the dashboard I did this:
type: custom:apexcharts-card
graph_span: 24h
stacked: true
header:
  show: true
  title: Total Power
series:
  - entity: sensor.solar_power_corrected
    type: column
    name: Produced
    color: '#01B4DE'
    group_by:
      func: avg
      duration: 5min
  - entity: sensor.envoy_SN_current_power_consumption
    transform: return x *-1 ;
    type: column
    name: Consumed
    color: '#F37320'
    group_by:
      func: avg
      duration: 5min
  - entity: sensor.net_power
    type: column
    name: Imported/Exported
    transform: return x *-1 ;
    color: '#545456'
    group_by:
      func: avg
      duration: 5min
The duration field is only used to choose how granular/thick to draw the column of data in the graph. The duration field has no effect on how often home assistant records the data.
End result is this
Keeping in mind that this view is only charting the consumption and production and net power sensors in W or KW
If you meant grid import and grid export energy figures in Wh or KWh, then they are also updated every minute at the least, but if it’s night time then the grid export sensor won’t update till the sun comes up and energy starts being sold to the grid.
Ah yep. I see how that would be confusing. As that post is talking about a view card, the modification is done in the dashboard area.
Go to
edit dashboard
add card
custom: apex cards chart (it’s a hacs Lovelace interface repo found at GitHub - RomRider/apexcharts-card: 📈 A Lovelace card to display advanced graphs and charts based on ApexChartsJS for Home Assistant )
Then put the yaml into the
card config
ok done. but I noticed the card is too small… Am I missing something? Also dont see the icons up top as per your screens.
Also found the reason for the error in the code its the “-” missing infront of the “name: Grid Export Power”
Change the view type to panel.
To do that. Press the 3 dots and edit dashboard. Then press the pencil icon for that home tab.
As for the icons, that my custom dashboard I’ve created and given icons to each panel.
Ok yes that fixed the view. I am gonna now gonna tackle the cost in your code. If the usage is a set price which is 0.2787 and daily supply is around 0.92, guess I dont have peak and off peak like you.
I noticed something interesting now. The total consumption for the day is around 4kw less but the export to grid is higher compared to the app. Cant figure that one. Do you see anything wrong in this snip?
Hello, I tried to use the energy dashboard, but for some reason, this doesn’t work:
For ‘Solar Production’, the today_s_ENERGY_production sensor is the ONLY enphase sensor that will work with energy dashboard by default without modifying home assistant and creating extra power and energy sensors.
In my current power production I see that my solar panels are generating power.
But even after a day the today_s_ENERGY production sensor still shows up 0.
Any suggestions?
Thanks in advance!
Regards.
Rein
Your issue reminded me of this other post.
Are you using the ha core enphase integration or a forked repo via HACS?
On the ha core enphase integration, there are 4 production related sensors and 4 consumption related sensors.
The 4 sensor names contain:
current_power
today_s_energy
last_seven_days_energy
lifetime_energy
Have you checked all 3 energy sensors to see if any of them are increasing?
I suspect you might be using a forked HACS repo for your enphase system and that might be introducing unexpected problems. If that is the case, then you need to raise a problem with the author of the repo on GitHub if your power sensor is working but energy sensor is not.
Hi @Mrsash
Maybe don’t use the lifetime sensor for production.
The today_s_energy is more suitable as it resets at midnight like this.
update: Let solar do its thing without touching it yesterday.
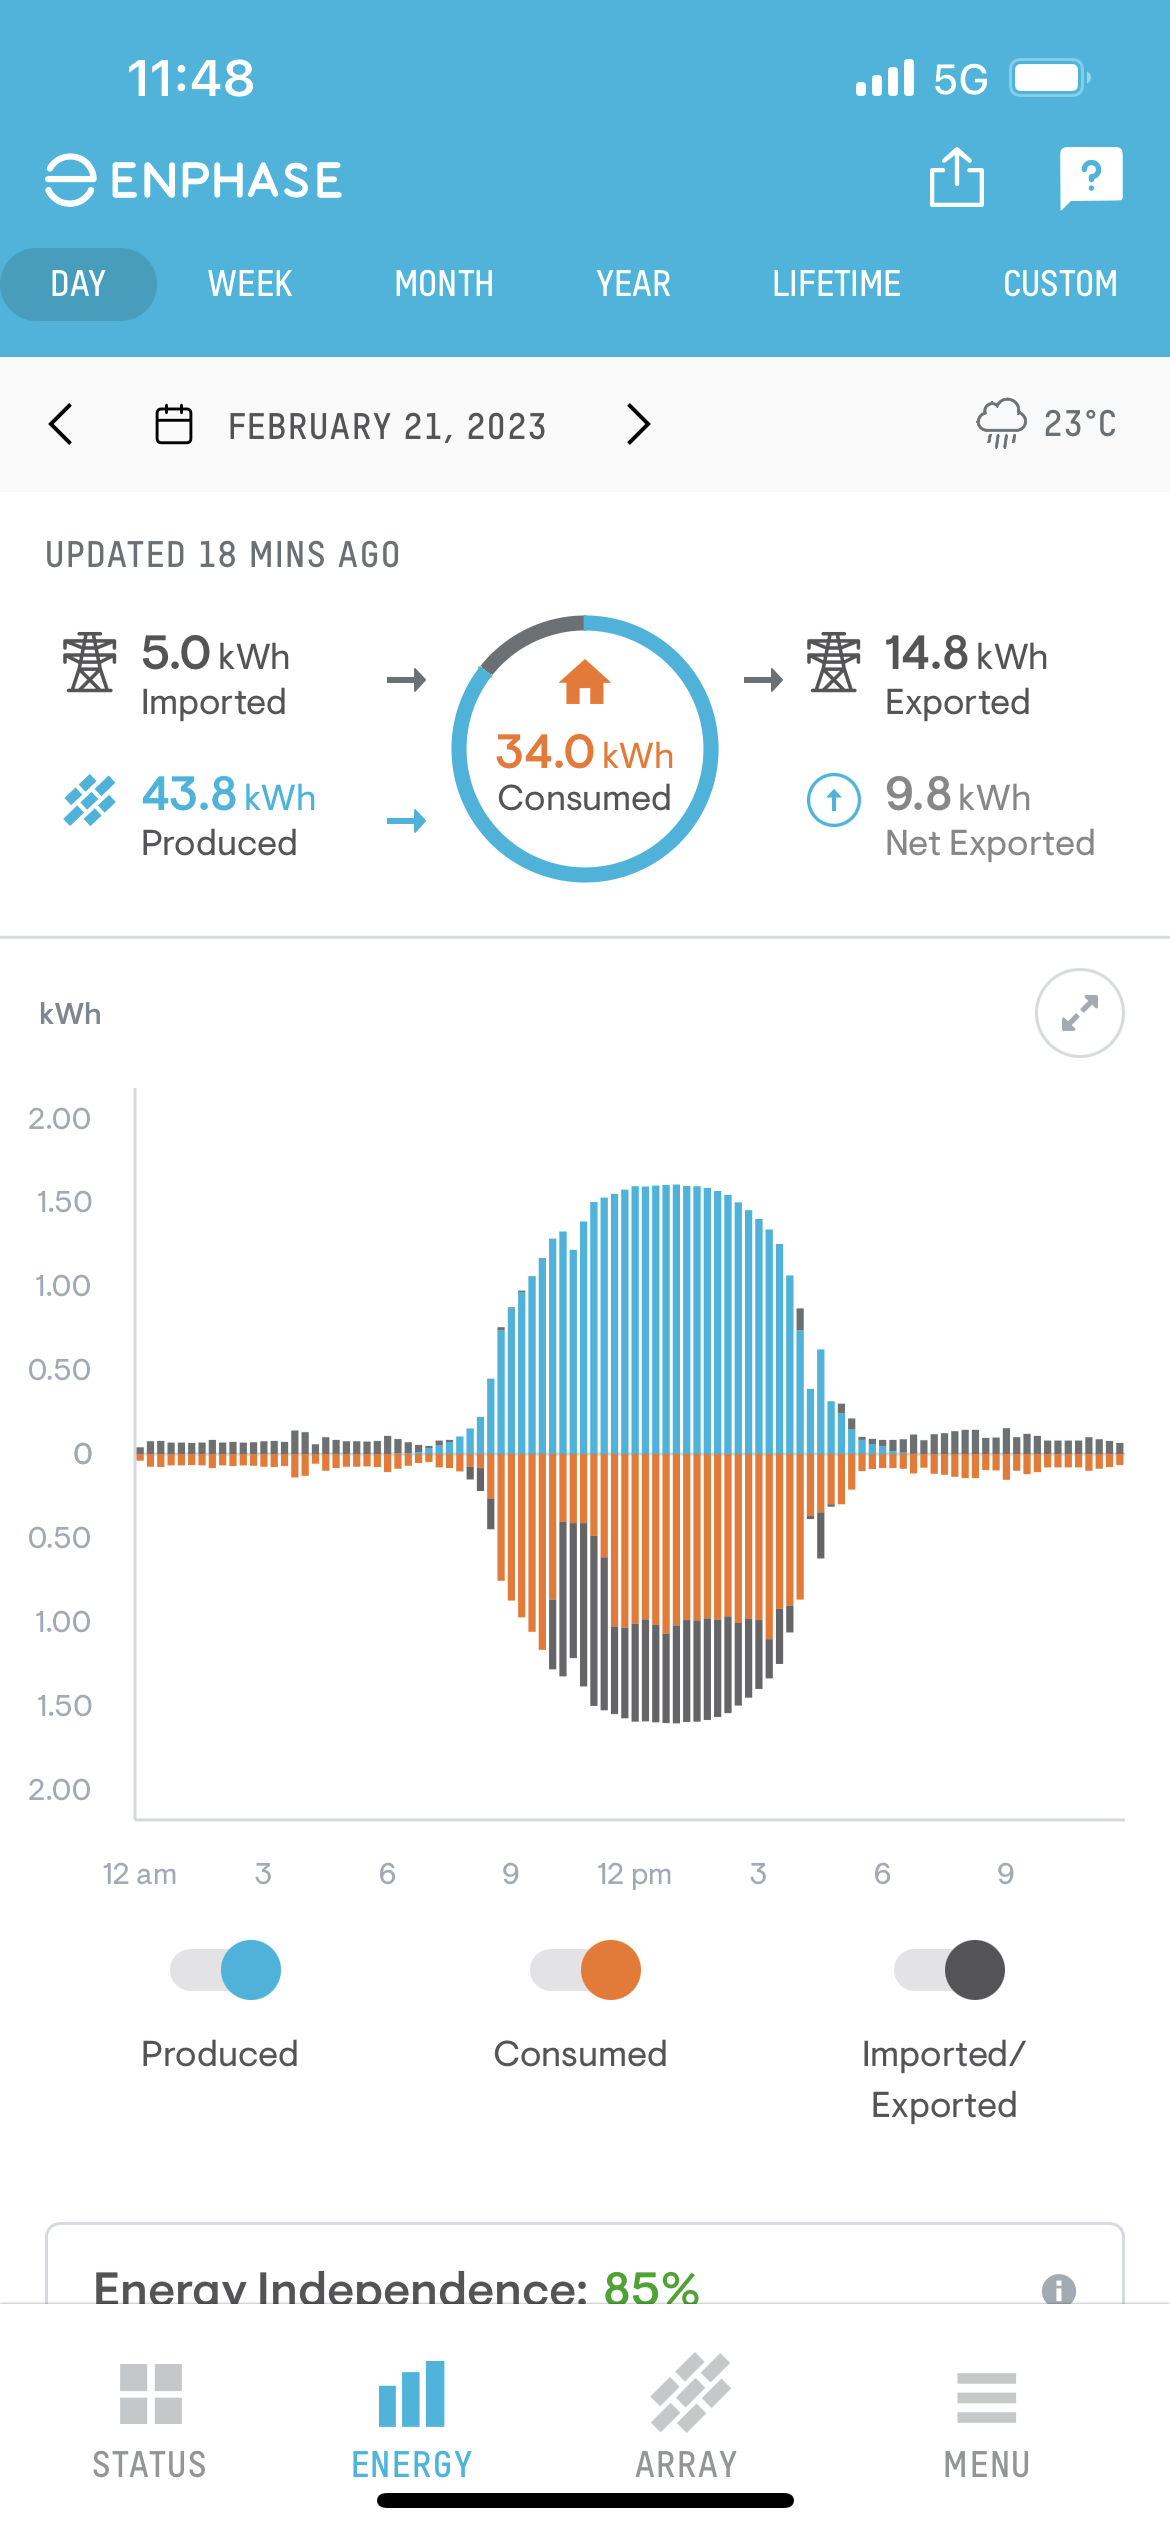
dash shows
App on phone shows
There is definitely a discrepancy. Any thoughts?
Using ha core integration, didnt install anything from HACS for enphase. If you mean these should be more than zero then yes. Will monitor in a few minutes. Basically I want to duplicate what you have in the core integration.

update: Yup they are updating and increasing. The only one that didnt change was grid import(maybe because overporducing right now
Hi @Mrsash,
Regarding the core/hacs question, that was me replying to @reinhochstenbach’s post.
Regarding your discrepancy, the production and consumption totals are within 0.1KWh to 0.2KWh of each other which I would be ok with.
Where they get wild is the is the grid import and grid export seems to be incorrect by 1.5KWh to 1.8KWh in the wrong direction. This means that the integration integration approximated that export was occurring when instead import was actually occurring.
There are at least 3 factors that can influence the figures not being totally identical:
Was HA rebooted at all for the 24 hour period?
Did the enphase envoy wifi connection drop out at all for the 24 hour period?
This final factor is most likely and not much can be done about it unfortunately given the granularity of data samples it has to work with:
The integration integration uses Riemann Sum to approximate what might have occurred between the 1 minute samples.
At this point, the only lever you could play with is this:
Riemann sum method to be used. Available methods are
trapezoidal,leftandright
I’ve chosen left but feel free to try the other 2 methods and see if that improves or makes it worse.
Right
Imagine each column as the minute samples and the blue shaded area being the approximation for each different method.
If you want even more granular data from the enphase envoy, there is an add on that can get data up to every second using mqtt protocol, however it only works with v5 firmware and also consider that HA will be processing and storing 60x more data if you decide to use it.
See:
I tried playing with the trapezoidal , left and right settings but that did not really help.
The consumption and production values are pretty close, its only the Grid thats off
Also whats your experience like?
Hi @del13r ,
Thanks for your reply.
I have a D7.* firmware and indeed am using the Enphase Envoy Dev integration.
I will check with the author of the dev repo 
Thanks again!
Regards
Enlighten 27.02

HA 27/02

Enlighten 26/02

HA 26/02

Enlghten 25/02

HA 25/02

Enlighten 24/02

HA 24/02