Hey guys! I found an issue with my data reporting here
When the day ticks over, the production doesn’t start at zero, instead it starts at 3.54kWh. Is there anything I can do to fix this? Here’s my energy dashboard
Sure, I just wrote about how this works in another topic.
As for how you would do it, you would find the name of your solar power production sensor and use that in the “Input Sensor:” field.
My only warning would be to make sure your power sensor is in W (Watts) as Riemann sum integral seems to only work when I use a sensor expressed in W (Watts) in my experience.
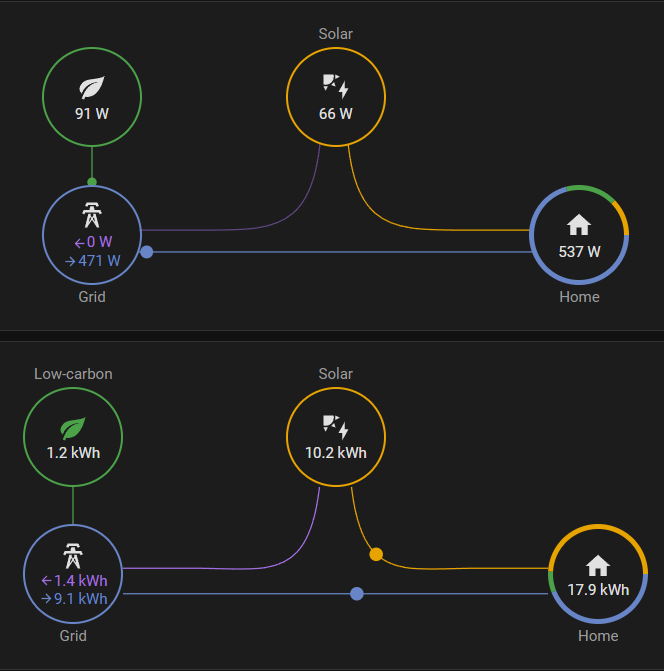
so… I was playing with the way it shows me all this info. I wanted to incorporate the energy distribution for the day on the top right. At the moment its just a duplicated live usage powerflow card entity. Any thoughts?
Energy Dashboard updates once every hour.
Enphase enlighten cloud updates every 15 mins.
Your sensors in home assistant update every minute if using the native enphase integration.
I use the sensors to create power and energy graphs like this
No, just history graph built into home assistant. I put them all into the same history graph and home assistant draws a different graph for each metric type (W, kW, kWh, $)
Oh right. I have only one rate, no peak or off peak. I just added this.
Any way to define what the start time?
Also would have loved to see ability to do on the fly change of view to see breakdown last 2 to 8 hours progressively.
Thanks. I am currently having issues with Apex chart and memory leak in firefox. Dam thing crashes, so using Edge which is also blowing up in memory usage.
I finally got this working and here is my automation for the water tank. Works like a charm.
Parameters that I can change are:
time to switch over to element and back
temperature limit for heat pump and element operation.
All four targets I am thinking of using helpers to setup if I want a front dash interface instead of accessing the automation settings. Depends on how frequently I am doing it I guess.
Update: I changed it to accommodate if export is below 1w.
Thanks for your help again.
alias: Water Heater
description: ""
trigger:
  - platform: numeric_state
    above: 1400
    for:
      hours: 0
      minutes: 2
      seconds: 0
    entity_id:
      - sensor.grid_export_power
    id: Overproduced Energy
  - platform: numeric_state
    for:
      hours: 0
      minutes: 0
      seconds: 10
    entity_id:
      - sensor.grid_export_power
    id: Underproduced Energy
    below: 1
condition: []
action:
  - choose:
      - conditions:
          - condition: trigger
            id:
              - Overproduced Energy
          - condition: state
            state: "off"
            entity_id: binary_sensor.dynamic_x8_heat_pump_element
          - condition: sun
            before: sunset
            after: sunrise
        sequence:
          - service: water_heater.set_operation_mode
            metadata: {}
            data:
              operation_mode: electric
            target:
              entity_id: water_heater.dynamic_x8_heat_pump
          - service: water_heater.set_temperature
            metadata: {}
            data:
              temperature: 70
            target:
              entity_id: water_heater.dynamic_x8_heat_pump
            enabled: true
          - service: notify.notify
            data_template:
              message: Water Heater Element On
      - conditions:
          - condition: trigger
            id:
              - Underproduced Energy
          - condition: state
            state: "on"
            entity_id: binary_sensor.dynamic_x8_heat_pump_element
            enabled: true
          - condition: sun
            before: sunset
            after: sunrise
            enabled: true
        sequence:
          - service: water_heater.set_operation_mode
            metadata: {}
            data:
              operation_mode: heat_pump
            target:
              entity_id: water_heater.dynamic_x8_heat_pump
          - service: water_heater.set_temperature
            metadata: {}
            data:
              temperature: 60
              operation_mode: heat_pump
            target:
              entity_id: water_heater.dynamic_x8_heat_pump
            enabled: true
          - service: notify.notify
            data_template:
              message: Water Heater Element Off
mode: single