Enphase Envoy with Energy Dashboard

Hi @del13r, thank you so much for these suggestions, you were indeed correct. The value is in the home.json page, under a section called enpower and grid_status as below. [yes was doing this during an outage]
[{“signal_strength”:0,“signal_strength_max”:0,“type”:“zigbee”,“connected”:true},{“signal_strength”:0,“signal_strength_max”:0,“type”:“subghz”,“connected”:true}],“enpower”:{“connected”:true,“grid_status”:“open”}}Screenshot 2022-08-09 4.07.22 PM

I got close using your data scraping idea, one difference is I can only locally access via https, but found that verify_ssl:false should work. I’ve been using the following but the sensor (or binary sensor) just rotates between unavailable and unknown states. I know I’m missing something simple, just don’t know what. PS what does the [0] after your consumption section do?

sensor:
- platform: rest
verify_ssl: false
resource: https://192.168.12.111/home.json
name: “Grid Status”
value_template: ‘{{ value_json.enpower[0].grid_status }}’

Envoy: IQ Combiner 3

  • Software VersionD7.3.75 (47f7da)
  • Software Build Date31 Mar, 2022 4:02 PM

Update:
The white, rounded corner shaped envoy-c is not capable of consumption monitoring.
image

The square shaped envoy-s is the only model that supports consumption monitoring.
image

See Enhpase Envoy on 2021.8 with new Energy feature - #103 by del13r

I think I might know what the issue may be.
Since v7, the firmware may require a JWT token to ‘securely’ access this data.
I am on v5 firmware that does not require a token.

You may have to add something like this to the platform: rest sensor

    headers:
      Authorization: >
        Bearer {{ states("input_text.my_access_token") }}

use this link to generate the 12 month token (replace the text at the end with your envoy serial number)

Tech Brief here
https://store-d9.enphase.com/download/techbrief-iq-gateway-access-using-token-en-us

I am not sure if the [0] is necessary to be honest.

As I am on an older version firmware and you have only posted a sample of your json file, it’s hard to give you an answer if this is correct or not.

For example, here is a breakdown of the structure of my home.json file

Here I can see that I have 2 interfaces.
0 is Ethernet
1 is Wifi

As a test, I successfully setup the following sensor.

sensor:
  - platform: rest
    resource: http://envoy.local/home.json
    name: envoy wifi strength
    value_template: '{{value_json.network.interfaces[1].signal_strength }}'

And this is the result (after adding the above code and then restarting home assistant)

My wifi strength is a 3 out of 5 or 60% presumably.

My formatting may not be perfect, but this test demonstrates that it is possible to extract data from the home.json file on the v5 firmware into a sensor in home assistant. V7 firmware just adds extra hurdles like HTTPS and JWT so Enphase can appear to be more secure.

Hi all…love this thread and it has helped me enormously in getting my data in place but I do have a small issue and I cannot figure it out so hoping a wider brains trust can point me in the right direction.

I have my sensors collating the energy data on a daily basis for the various tariffs however only one of the monthly settings will record any data.

utility_meter:
  daily_energy:
    source: sensor.grid_import_energy
    name: Daily Import Meter
    cycle: daily
    tariffs:
      - offpeak
      - shoulder
      - peak

  monthly_energy:
    source: sensor.grid_import_energy
    name: Monthly Import Meter
    cycle: monthly
    tariffs:
      - offpeak
      - shoulder
      - peak

  daily_energy_export:
    source: sensor.grid_export_energy
    name: Daily Export Meter
    cycle: daily
    tariffs:
      - buyback

  monthly_energy_export:
    source: sensor.grid_export_energy
    name: Monthly Export Meter
    cycle: monthly
    tariffs:
      - buyback

The monthly collection is only working for the offpeak and is continually collecting regardless of the time of day. The automation that controls the switching between the tariff periods works perfectly as can be seen in the daily stats.

Any help and direction here would be much appreciated

Hi, thanks.

Check these examples if you are stuck.
I had to change to yaml view, by pressing the 3 dots on the right, so I could fit it all on the screen.


Cheers…figured it out with a touch of 3am inspiration (stupid brain should have been sleeping).

I had not set my monthly counter collection in the trigger automation to switch between the tariffs. This is what you have shown me here as well - appreciate the time to respond.

For anyone struggling with utility meter, please use the example taken directly from
https://www.home-assistant.io/integrations/utility_meter/#advanced-configuration

Hi all- can anyone advise on how to enable monitoring of each inverter?

With the older version that accepted yaml configuration, it seemed easy enough- but I can’t see any way to enable it in the GUI.

Cheers!

Older version of firmware? If so, what version are you talking about?

Ah never mind! I removed the integration and then re-added using the installer password. They all seem to be there now :+1:

Hey guys,

Just got my Enphase Envoy monitoring placed by the company I got the panels from.
HomeAsisstant finds the Envoy withouth any problem, so no issues there.

However, I can’t logon with any of the suggested passwords, combo’s i’ve tried:

  • envoy /
  • installer /
  • installer / used the .APK to generate an installer password from the S/N
  • my enphase username (email) / created password from the link I got when they installed the unit.

Also got it off the WiFi and hooked it up to my LAN with a cable and changed IP addresses from DHCP to static. Got the power off and restarted the device. No luck.

When trying to logon with the username envoy but blank password I got the error “unexpected error”

However, when I logon with generated installer password it’s telling me “can not connect”

So, I have no clue what is going wrong as I tried all possible combinations.
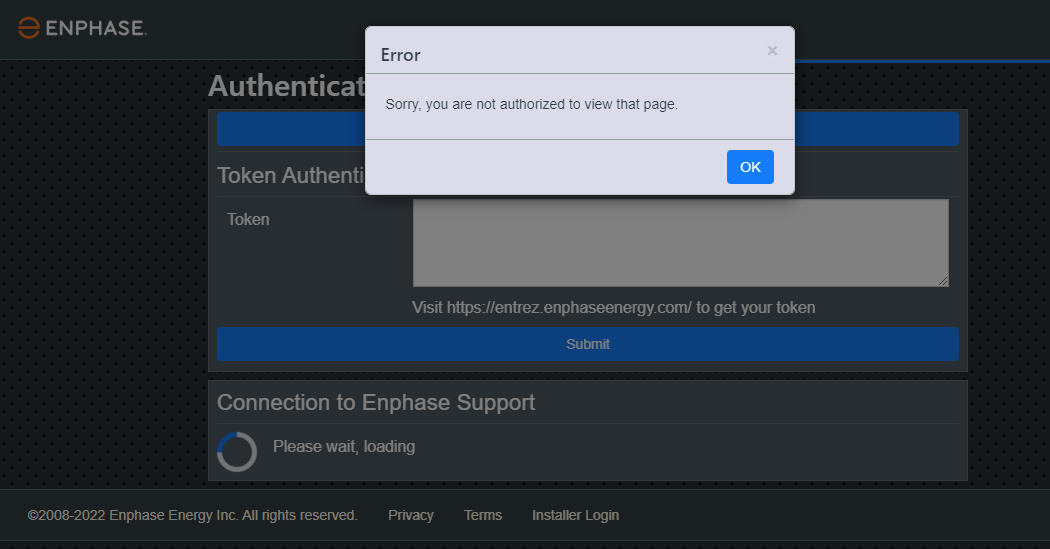
Another thing I notice (not sure if it’s normal) it when I browse to the IP of my IQ Gateway (monitoring) then I’m greeted with a page to enter an authorization code

Not sure if this token is required etc…

Hope somebody can help me with this :slight_smile: Thanks in advance!

Got it logged on with this addon: GitHub - briancmpbll/home_assistant_custom_envoy

This one works for me: GitHub - jrutski/home_assistant_envoy_d7_fw: Update for D7 based firmware on Envoy gateways , , just incase others see this thread. Not sure the difference.

I have the exact situation with the Current Consumption, it’s positive when consuming more than produced and it’s negative when it’s exporting. I’ve spent two days trying to figure this out. You saved my day xDDD
Thanks

1 Like

thank you so much for this!

quick question… is the original (1st) post being updated with the latest instructions, template & sensors? I started reading down from the start and there’s so much information… just want to be sure i’m doing this correctly. thanks again!

I follow every step but my Grid Import Power shows 0. Under the sensor it self shows the correct energy import. but just wont show here.
Everything else is working as expected.

template:
  - sensor:
      name: Grid Import Power
      state_class: measurement
      icon: mdi:transmission-tower
      unit_of_measurement: W
      device_class: power
      state: >
        {{ [0, states('sensor.envoy_SN_current_power_consumption') | int - states('sensor.envoy_SN_current_power_production') | int ] | max }}
  - sensor:
      name: Grid Export Power
      state_class: measurement
      icon: mdi:transmission-tower
      unit_of_measurement: W
      device_class: power
      state: >
        {{ [0, states('sensor.envoy_SN_current_power_production') | int - states('sensor.envoy_SN_current_power_consumption') | int ] | max }}

sensor:
  - platform: integration
    name: Grid Import Energy
    source: sensor.grid_import_power
    unit_prefix: k
    unit_time: h
    method: left

  - platform: integration
    name: Grid Export Energy
    source: sensor.grid_export_power
    unit_prefix: k
    unit_time: h
    method: left

This is going to sound obvious, You can only be importing or exporting power at any point in time, but never both at the same time. Is it possible that you are checking this in the day and that you aren’t importing any power at that point in time?

It was actually my fault, had some copy issue. lol. Thanks!
Now trying to figure out how to get the storage corrected.

Thanks!

Hello again vk2him,

I am hoping you can put me on the right track again. :neutral_face:

Back in August 2021 you helped me with my energy dashboard and it’s been working fine up until just recently when Efergy started becoming unavailable for a few weeks. This meant that I had no consumption data coming into the Energy Dashboard.

As Hildebrand, the supporters of this platform, have told me that the little Energyhive box I have was discontinued in 2017 and they aren’t allocating resources to fix it if the servers go down like they did just recently.

My thinking then was I should use something like the Home Assistant Glow and be independent of any cloud storage. I purchased the hardware and have flashed it up in ESPHome and I think I have it working as of yesterday afternoon.

This is what it looks like

However this is where I am stuck.

In my Efergy entity (sensor.power_usage_3097) I am seeing all of my current consumption in my house, both solar and grid.
image

In my Enphase Envoy entity (sensor.envoy_current_energy_production) I am seeing Solar production
Which is why you told me to do the subtractions in the code below.

However in the HA Glow for consumption I am seeing zero consumption in watts and other entities of House-Daily Energy in kWh and House-Total Energy in kWh

My Solar data source has not changed.
So I am confused as to how to change my current Energy Dashboard to use this new data???

#vk2him Configs for Energy Panel Solar, Import and Export sensors
#
  - platform: template
    sensors:
      exporting:
        friendly_name: "Current Energy Exporting"
        value_template: "{{ [0, (states('sensor.envoy_current_energy_production') | int - states('sensor.power_usage_3097') | int)] | max }}"
        unit_of_measurement: 'W'

      importing:
        friendly_name: "Current Energy Importing"
        value_template: "{{ [0, (states('sensor.power_usage_3097') | int - states('sensor.envoy_current_energy_production') | int)] | max }}"
        unit_of_measurement: 'W'
 
      solarpower:
        friendly_name: "Solar Power"
        value_template: "{{ states('sensor.envoy_current_energy_production')}}"
        unit_of_measurement: 'W'
   

sensor 10:
  - platform: integration
    source: sensor.solarpower
    name: energy_solar
    method: left
    unit_prefix: k
    unit_time: h
    round: 2

sensor 11:
  - platform: integration
    source: sensor.exporting
    name: energy_exporting
    method: left
    unit_prefix: k
    unit_time: h
    round: 2

sensor 12:
  - platform: integration
    source: sensor.importing
    name: energy_importing
    method: left
    unit_prefix: k
    unit_time: h
    round: 2
#
## End vk2him
#

This is what my Energy dash board looks like at the moment

Very Confused. If you can help I would appreciate it.
Thanks in advance!