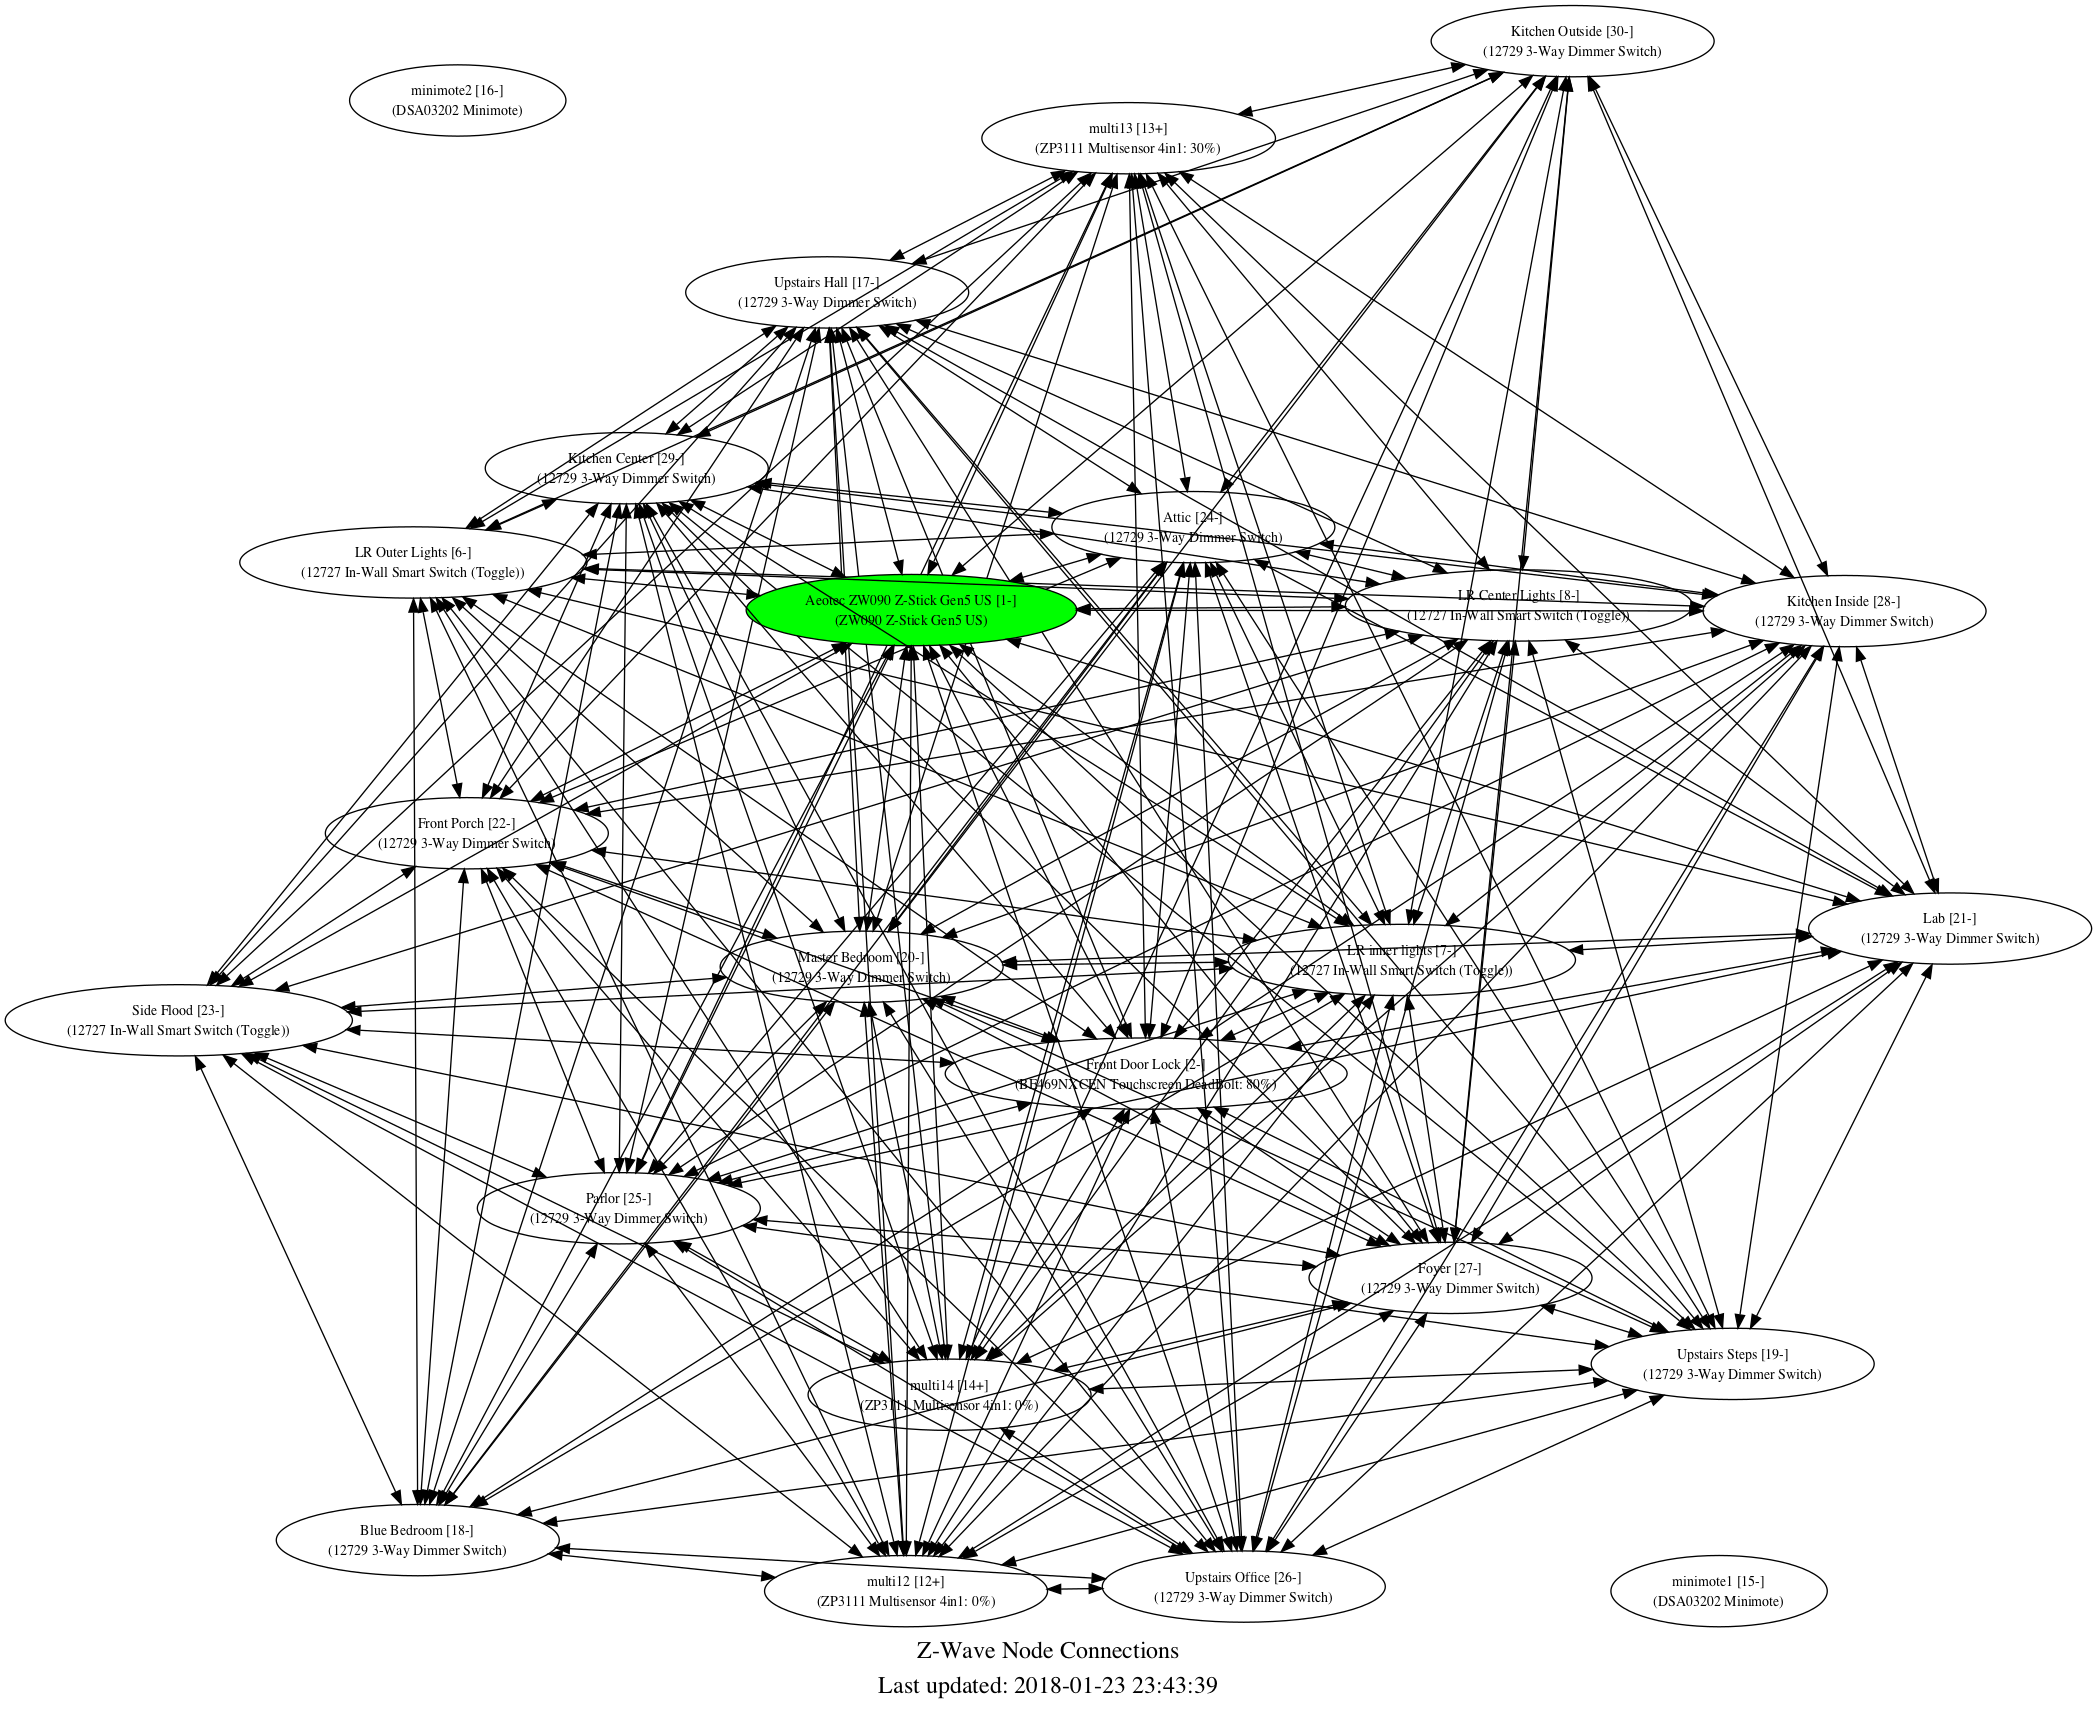
I fiddled around with your script; had to sort of hack on it a bit due to my non-standard installation on macOS and the directory the virtualenv was installed into. Still, here’s a somewhat more complex z-wave network that I have. Interestingly, the two minimotes show as disconnected since they’ve not been used in a bit…
Hard to figure out how you lay out this prettier in an automatic way. One thing that would be interesting is to colorize the edges in the graph back to the z-wave adapter.
I’m a bit surprised at how well connected my zwave devices are, and the fews that are not are interesting and make sense while I think about. For instance, the “Kitchen” dimmers (some of them, anyway) are in a congested 3 gang box, and there’s some large metal appliances directly in the path towards the zwave stick. So it makes sense they use some neighbors to get back…
Thanks for doing this!