Somehow, a few days ago, my energy dashboard thinks my solar array generated 7000 kWh of power in under an hour. Man that would be sweet if true! This setup has been running stable since January this year, this is the first time it’s happened. I’m going to put it down to an unexplained glitch and move on - will investigate further if it happens again.
Anyway, how do I remove this? It’s throwing all my graphs way out of whack.
Under “Developer Tools” on the Statistics tab. On the far right beside your entity you should see a “ramp” icon. Click it and you can search around 30th August 7pm and find the rogue value. From there you can change it to zero (or another number).
What I normally do is look at the states either side of erroneous one(s) and take the average.
This was likely caused by your sensor reporting 0 instead of ‘unavailable’. There are ways to prevent this happening. If your sensor is defined in YAML please post it and we can help you fix it. Otherwise you may need to feed your sensor to a template sensor and feed that to the energy dashboard. You should probably also open an issue for the integration in this case too.
Thanks - I managed to fix it. Just changed it to Zero, didn’t have to guess/average out any values because it was 7:50 PM and there’s no sunlight here at this time of day.
This is the “energy total” figure, i.e. how much it’s generated this year so far. It should only ever increase right? But it is rolling back strangely:
@tom_l , I recently fixed an issue in HASS where a number of my Zigbee power plugs were reporting incorrect power usage.
Unfortunately, I now have incorrect data for a number of my “helper” entities (screenshot below). I tried the same method as above to fix this, however it doesn’t look like it will let me. If it matters, the entities I’m trying to fix are “helper” entities that convert instantaneous watts to kWh, daily kWh total and monthly kWh total. How can I fix these?
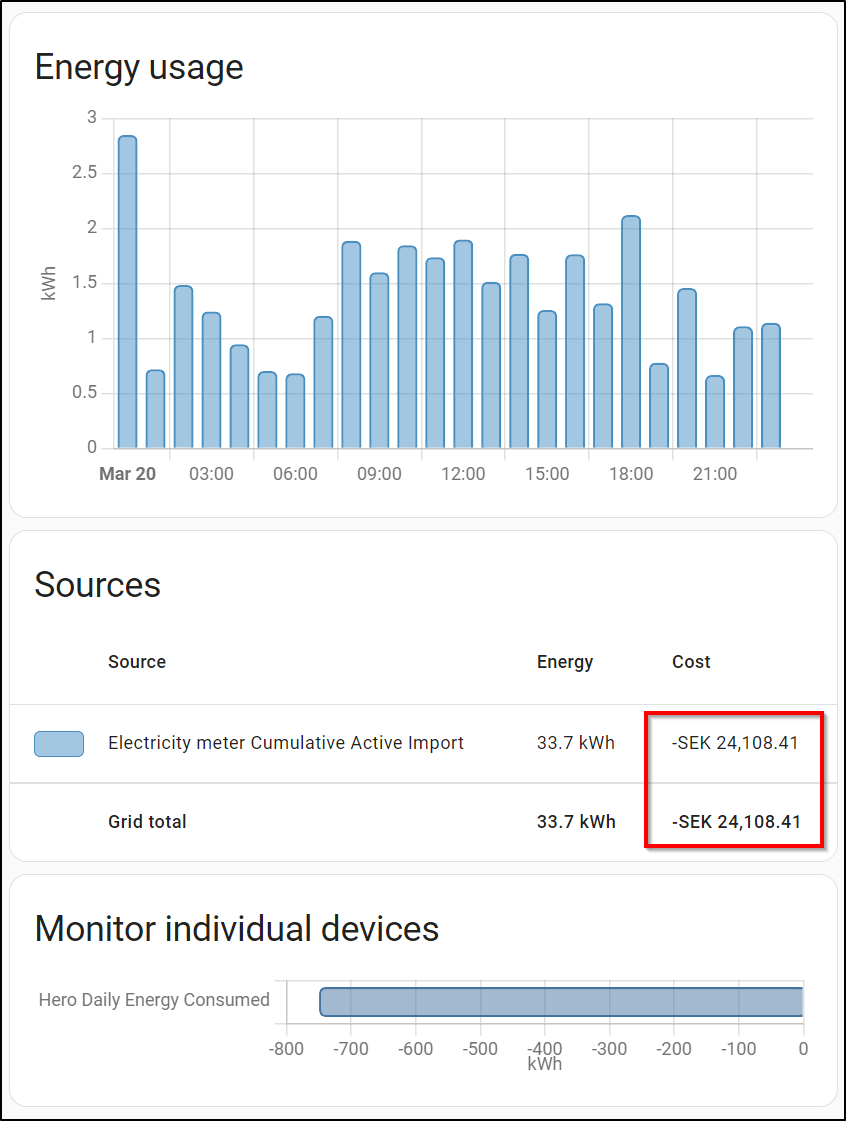
I had a similar issue, when one energy (kWh) reading happen to be -14000 kWh once. I adjusted it to 0 in the Developer Tools - Adjust a statistic. But the calculated price are still a very big negative value. How can I fix it?