High disk read and high cpu load in HAOS Proxmox VM

Hello,

I have a problem with my HAOS installation which has been working fine for more than a year. After an uptime of less than 24h it becomes unusable due to high disk reads and cpu load also increases to unusual ranges. (Proxmox VM, 2 cores, 3GB RAM).

I have no idea how to identify what causes the disk reads since it seems impossible to install additional packages on HAOS.

What I have tried:

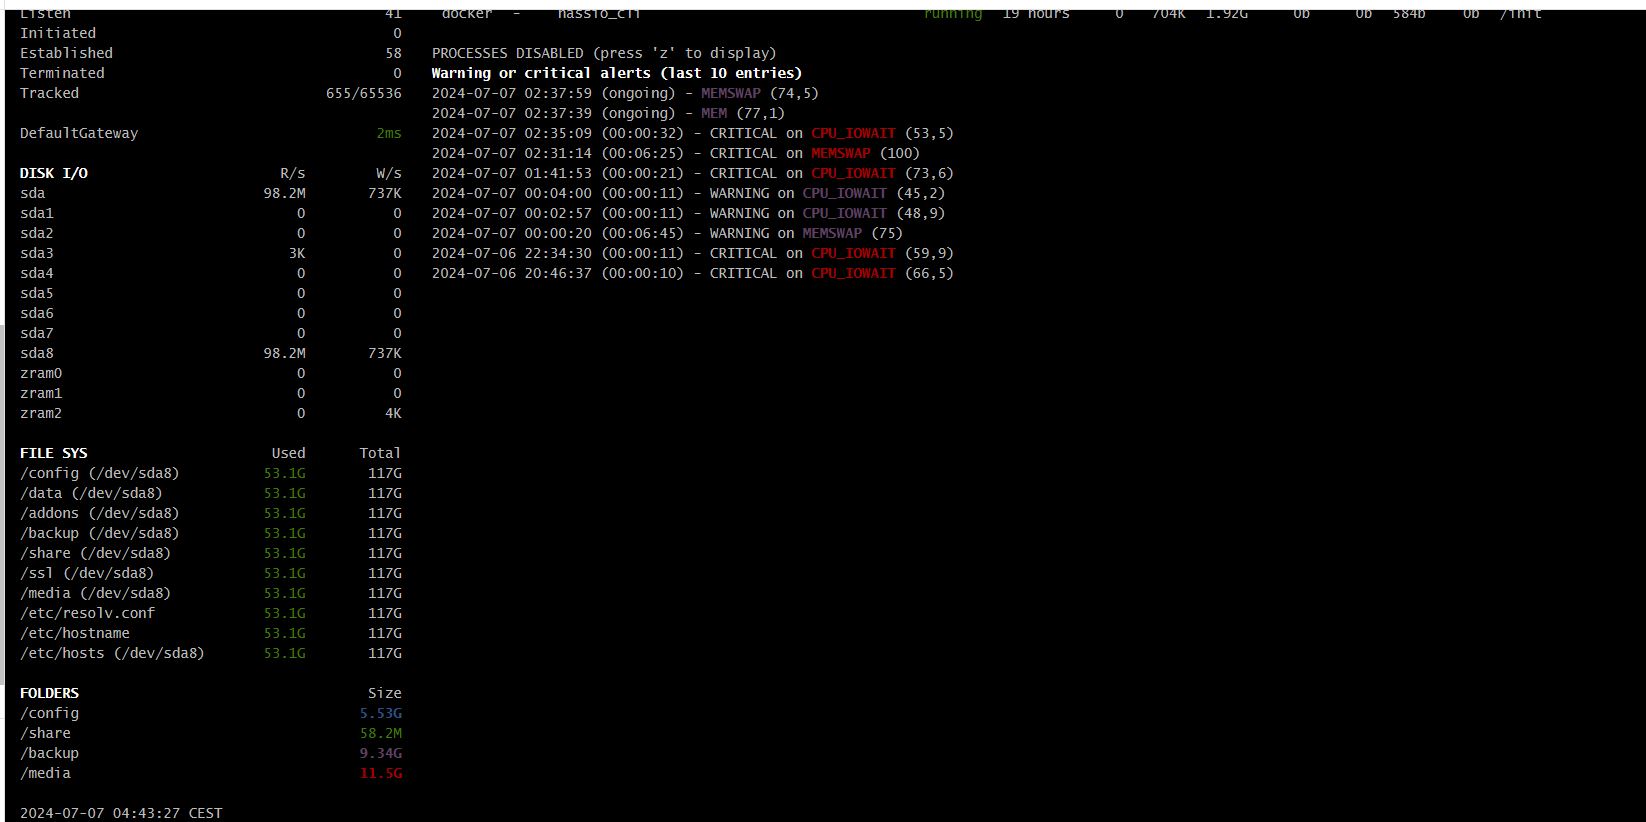
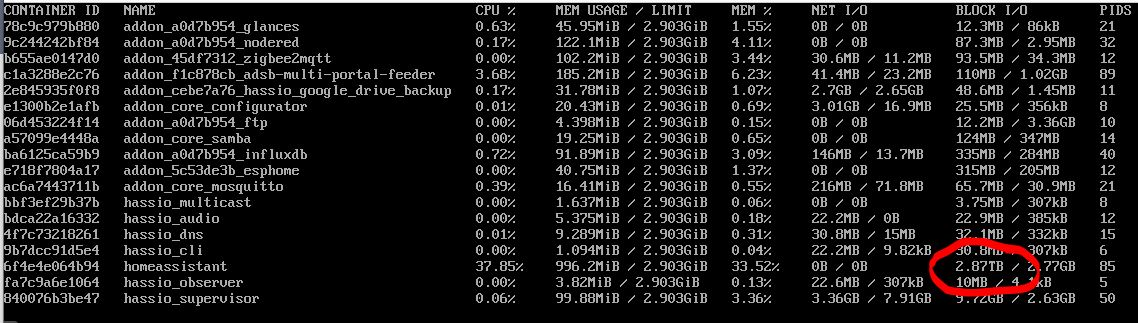
  1. Glances Addon - tells me that the homeassistant docker image is the main cause of the cpu load, but not why. Shows me high disk reads without significant writes, so I assume it is not caused by swapping. Increasing ram on the machine also did not solve the problem.

  1. Running “top” on HAOS - tells me nothing new, interestingly the cpu load shown here is always significantly lower than the one that Proxmox displays for the machine at the same time (e.g. 13 vs 50%)

  2. Running py-spy: Does not work, error message “Unsupported version of Python: 3.12.0”

  3. Profiler integration: ran it but have no idea how to interpret the output. Would it be helpful for finding the cause of disk reads at all?

  4. Changed the loggin settings to

logger:
  default: warning
  logs:
    homeassistant.core: debug

The logs show nothing of significance when searching for warn, error or RuntimeError.

What else should I try? Your help is appreciated! Thanks :slight_smile:

Hi,

On HAOS level, in command line you do nothing. You did unnecessary troubleshooting. First of all find out how to get logs from this particular LXC container or virtual machine in Proxmox. Proxmox does not use Docker. So this is something that is weird. I suppose you installed it using Proxmox script for Home Assistant. Am I right? You can always do a backup to a Google Drive. Get rid of this machine from Proxmox, install Home Assistant using the script made for Proxmox that will install HA for you in Proxmox and then you install the backup plugin for Google drive and restore the backup.

I would prefer avoiding a complete reinstall. I would rather find out what causes this.

I installed it in a VM using ttecks install script, correct. But this was at least two years ago and it has been working flawlessly ever since.

I do not quite understand what you find weird - or is this a misunderstanding? The top output is from HAOS, not from proxmox.

Any ideas how to troubleshoot this issue apart from a full reinstall?

I perfectly understood what you wrote in the first post. Well, just in Proxmox usually people install Home Assistant as a LXC container rather than a virtual machine. If this is a virtual machine, then well I suppose it contains a Docker. What sudo docker ps shows? Is Docker up to date on this virtual machine? What distro is running in this virtual machine? What sudo cat /etc/os-release shows? Is the distro up to to date? I do not know the script you mentioned. What sudo sar displays? By the way you can read about sar usage. Which exact script did you use to install Home Assistant? I can analyse it. If you are using Portainer, is the Portainer up to date?

NAME="Alpine Linux"
ID=alpine
VERSION_ID=3.20.0
PRETTY_NAME="Alpine Linux v3.20"
HOME_URL="https://alpinelinux.org/"
BUG_REPORT_URL="https://gitlab.alpinelinux.org/alpine/aports/-/issues"
~ #
~ # sudo sar
sudo: sar: command not found

I do not have high disk reads at the moment, so sudo docker ps only shows healthy containers. I will check again when the problem reoccurs.

Everything is current, this HAOS version comes with Docker 26.1.3:
version

I would make a backup of your Media folder and then delete everything in it to see if that reduces the disk reads. The next option would be to stop/disable Add-Ons and Integrations one at a time to see if you can isolate one of those as the cause.

Thank you!

There is no significant network traffic. How could the media folder explain the disk reads?

I have already stopped all Add-Ons and most integrations and seen no difference.

Is there any tool that could show me (on HAOS) what is accessing my disk?

I just noticed that your Media folder is 11.5 gig and thought something might be reading or indexing it. Your Config folder is 5.5 gig, while mine is 63 meg, so that seems quite large also. You might want to see what files in those folders are using the most space. What is the size of your HA database?

How do I see the database size?

This contains the video recordings from my Reolink doorbell. I have emptied the folder with no change.

I used docker stats and can at least see that the problem seems to be HomeAssistant itself and not an addon.

I also noticed that the problem starts every night at precisely 4:00AM.

Update:
I found out that sda8 has the high read acitivity:
sda8
What could be on there that causes it?

The only logic reason is that Home Assistant is doing something exactly at this exact time. So I would reconsider to write a script for Alpine to monitor processes that are running. You can then run the script using a crontab directly at the same time and monitor running processes with top, iotop and ps -ef or ps aux. I will write a script and put it here for you.

Here is a Bash script that will monitor CPU usage, I/O usage, disk, RAM, and swap usage for 60 minutes and log the output to a file in a human-readable format. You can schedule this script to run at 4 am using crontab.

Monitoring Script

#!/bin/bash

LOG_FILE="/var/log/system_monitor.log"
DURATION=3600
INTERVAL=60

echo "System Monitoring Script Started: $(date)" >> $LOG_FILE

# Function to log system stats
log_system_stats() {
    echo "-------------------------" >> $LOG_FILE
    echo "Timestamp: $(date)" >> $LOG_FILE
    echo "" >> $LOG_FILE
    
    echo "CPU Usage:" >> $LOG_FILE
    top -bn1 | grep "Cpu(s)" >> $LOG_FILE
    echo "" >> $LOG_FILE

    echo "Disk I/O Usage:" >> $LOG_FILE
    iostat >> $LOG_FILE
    echo "" >> $LOG_FILE

    echo "Disk Usage:" >> $LOG_FILE
    df -h >> $LOG_FILE
    echo "" >> $LOG_FILE

    echo "Memory Usage:" >> $LOG_FILE
    free -h >> $LOG_FILE
    echo "" >> $LOG_FILE

    echo "Swap Usage:" >> $LOG_FILE
    free -h | grep Swap >> $LOG_FILE
    echo "" >> $LOG_FILE
}

# Run the logging function every INTERVAL seconds for DURATION seconds
END=$((SECONDS+DURATION))
while [ $SECONDS -lt $END ]; do
    log_system_stats
    sleep $INTERVAL
done

echo "System Monitoring Script Ended: $(date)" >> $LOG_FILE

Setting Up Crontab

To schedule this script to run at 4 am every day, you need to add a crontab entry. Open the crontab editor with:

crontab -e

Then add the following line to schedule the script:

0 4 * * * /path/to/your/script.sh

Make sure to replace /path/to/your/script.sh with the actual path to your script.

Notes

  • Ensure the script has executable permissions:
chmod +x /path/to/your/script.sh
  • The script logs system statistics every 60 seconds for a total duration of 60 minutes. You can adjust the INTERVAL and DURATION variables as needed.
  • The iostat command may require the sysstat package, which you can install with:
apk add sysstat

This should give you a comprehensive log of system usage metrics that are easy to read and understand.

I’m using MariaDB for my database and use the SQL Integration to get the database size as a sensor. To set it up point it to your database URL:

mysql://hassio:<my_password>@core-mariadb/homeassistant?charset=utf8

And then add the SQL query:

SELECT table_schema "database", Round(Sum(data_length + index_length) / 1024 / 1024, 1) "value" FROM information_schema.tables WHERE table_schema="homeassistant" GROUP BY table_schema;

Google Drive Backup starts at 4:00 AM?

See here, sounds like you’re another one hit by this issue:

2 Likes

Wow, thank you for your work! Unfortunately, HAOS appears to have no package manager and so I cannot install sysstat. Any way around this?

No, it started at 2. There was a sync that started at 4:00 AM, but stopping the Google Drive Backup-Addon did not change the crazy amount of disk reads.

07-08 02:13:11 INFO [backup.drive.drivesource] Deleting 'Partial Backup 2024-07-05 02:00:00' From Google Drive
07-08 02:13:12 DEBUG [backup.watcher] Checking backup source for changes...
07-08 02:13:12 DEBUG [backup.model.syncer] Sync requested by Backup Directory Watcher
07-08 02:13:12 INFO [backup.model.coordinator] Syncing Backups
07-08 04:01:37 DEBUG [backup.model.destinationprecache] Preemptively retrieving and caching info from the backup destination to avoid peak demand
07-08 04:01:37 DEBUG [backup.drive.driverequests] Requesting refreshed Google Drive credentials
07-08 04:01:39 DEBUG [backup.model.syncer] Sync requested by Coordinator
07-08 04:01:39 INFO [backup.model.coordinator] Syncing Backups
07-08 05:32:38 DEBUG [backup.model.destinationprecache] Preemptively retrieving and caching info from the backup destination to avoid peak demand
07-08 05:32:38 DEBUG [backup.drive.driverequests] Requesting refreshed Google Drive credentials
07-08 05:44:45 DEBUG [backup.model.syncer] Sync requested by Coordinator
07-08 05:44:45 INFO [backup.model.coordinator] Syncing Backups

Wow, this could be it! Recordings indeed stop at 4AM! I attributed this to the high cpu load.

My recorder settings are:

recorder:
  purge_keep_days: 30

I temporarily changed them to:

recorder:
#  purge_keep_days: 30
  auto_purge: false 

Lets see what happens at 4AM! However, I run none of the mentioned integrations.

1 Like

You nailed the issue. Kudos.

1 Like

Just to let you know that this indeed appears to be the issue, no problems tonight after setting

auto_purge: false 

Thank you to everyone who helped me find the culprit!

2 Likes