I am clearly not understanding something here
I have a homeassistant docker running
I have a working influxdb running
the homeassistant is reading data from a Synology device and posting the info into influxdb. However I am posting way too much data - almost all of which I do not want. In addition the data seems spotty and seems to tail off that I am assuming (at the moment) is because I am posting too much data into influxdb
So I need / want to only include data that I want into influxdb
I tried an include section in the configuration.yaml - but I clearly have something wrong
What I tried was:
Whats the correct formatting - which is clearly where I am wrong (probably) to only include the entity_id that I have selected
I don’t think I can select based on sensor, value or °C as they contain additional data that I do not want to see (AIUI) so its just the entities selected under the filter by entity_id that I want
Lets try again.
Its now working - but the orignal fault that I am trying to figure out is still present.
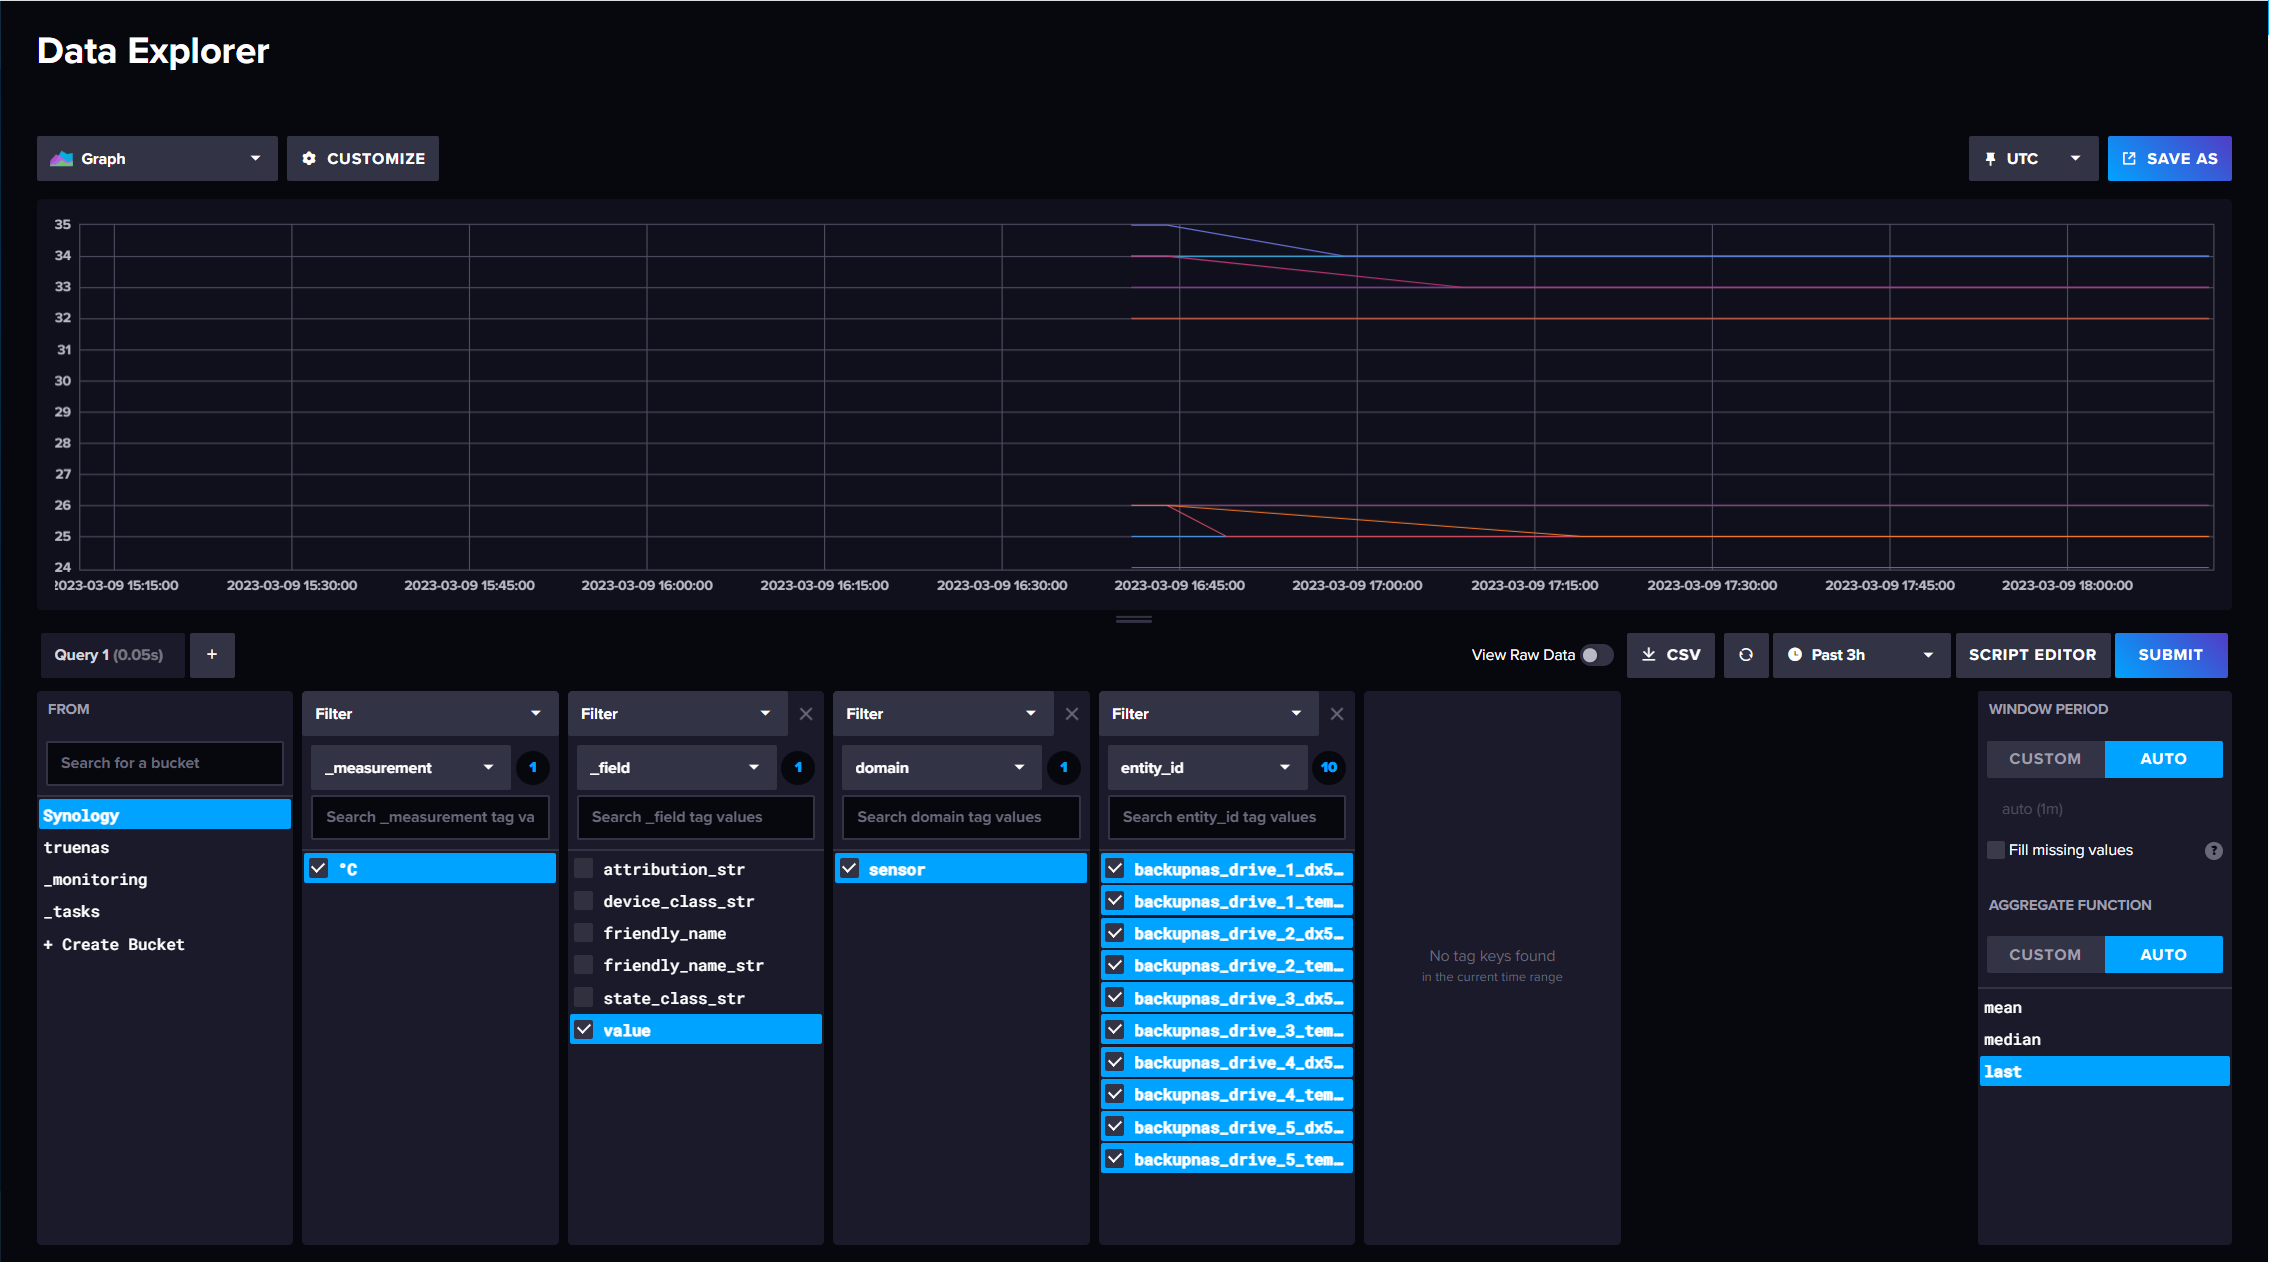
Homeassistant has been running for 1 hour. Taking readings every 5 minutes as you can see from the picture below. And when I mouse over a line there seem to be lots of data points.
As you can see the readings start off present, but rapidly stop, the last one going for 30 minutes before stopping.
I was hoping that by limiting what I was writing to influxdb to a limited set of data I would solve this issue. But apparently not - the readings just stop. Restarting HA brings the readings back briefly. I even tried putting homeassistant on aa different server - which had zero effect
For example, after restarting HS, influxDB looks like:
As you can see the red circle was while I left HA running for a while - no readings, and the readings before just rapidly petered out whilst the bluw circle is after a reboot / restart of HA
As far as I can tell HomeAssistant just stops writing to InfluxDB
Whilst all this is going on I am logging every 5 minutes from two TrueNAS boxes, every 5 minutes for more disks than are appearing here. This has been working for some time now
Not sure this is the case here:
the sensors are only updated ( and trigger writing to influx) when values change and that might not be the case too often for temperatures on a Synology disk drive
Here I described what I did when I was forwarding data to influx: InfluxDB to store data in intervals - Configuration - Home Assistant Community (home-assistant.io)
using templates sensors with an attribute based on time, forced to update every 5 minutes
Seems I was using the old style to define the template sensors, I stopped forwarding data to influx quite a while ago, it was working, but I never really looked at the old data
you likely have to rewrite that to the new style.
I think you are right - its only sending data when the values change - not what I am looking for as the charts look really crap @armin-gh I looked at what you posted - but I am afraid that just went woosh, straight over my head
we can try in smaller steps. You can put this into your configuration.yaml
if you do not have already other templates ( “template:” in Column 1) in your configuration, add this:
if you already have templates, add it under the last already existing template
this adds a new sensor with id “sensor.backupnas_drive_1_temperature_influx”. It duplicates your existing sensor but because of the attribute “update_now” it updates every 5 minutes.
Then add “sensor.backupnas_drive_1_temperature_influx” to your entities going to Influx. now you should see new data there every 5 minutes.
Also wanted to mention that the disadvantage of this method is that you have to create a new template sensor for every entity you want to have in Influx… might become a large list. I would do that only for selected entities, where long term statistics in Influx have a real value.
Seems to me this is pretty tedious to do for each sensor, coming from Openhabian their persistence for Influxdb was a bit simpler; add a sensor to a group, decide interval/strategy (cron, change).
BTW you can also decide for each sensor it’s strategy.
I have just started with HA and still struggling with the best Influxdb integration.
Maybe working with a (short) retention on the influxdb side is much easier?
I think it starts with carefully selecting which sensors/entities you really need with long term statistics and/or for visualisation for example in Grafana.
I have thermostats, lights, temperature, door/window-contact, humidity, … I meanwhile stopped storing to Influx, because I do not really need to know that temperature in my office was 20.1°C on a Sunday 6 months ago, but 19.8°C at the same time two weeks later… of course exaggerating a bit here…
I do not have photovoltaic, heatpumps or similar devices, energy produced or consumed would definitly be something I would store in a long term database ( and not to rely on data stored in the manufactures cloud )
But I agree also that influx-integration in HA would deserve better configuration, perhaps with yaml for the expert, but a list of entities in a GUI-configuration where I can select the entities I want to store and the measurement they should be stored in… would be nice…
Just to necro this post. I solved the issue by (and I know I am speak heresy here) bypassing HA. Instead I wrote a script that runs on the synology and post the disks temps directly to InfluxDB every five minutes. I can then graph this in Graphana. Its a bit of a hack and requires modification (kinda obvious how) if moved to a different synology and only (currently) works with HDD’s as SSD’s report temp using different details that I am not searching for. But:
I have no SSD’s in the Synology
I don’t care about SSD temps - they thermally throttle