As I said - I tried to call the “purge” service with the “repack” option , no results.
repack takes a long time, it’s not quick at all
The recorder.purge service does not look at your includes and excludes. As documented, this is all it does:
Call the service
recorder.purgeto start a purge task which deletes events and states older than x days, according tokeep_daysservice data.
So it does not matter what is in your include and exclude config. Any rows older then 10 days will be purged, any rows less then or equal to 10 days will not be purged.
If you want to purge data from a specific entity you believe has been wrongfully recorded, you need to use the recorder.purge_entities service. And then you need to specify which entity IDs, domains and/or entity globs to purge. Note that this service does not default to your include and exclude config, it also does not look at that. You must specify some entities to purge and it will purge only those.
The only part of recorder that looks at your include and exclude config is the live-recording aspect. As in when an event comes in it looks at your config to see whether that event should be recorded or not. Once an event is in the DB, it is not purged unless it is older then keep_days or you specifically tell recorder to purge its data via the recorder.purge_entities service.
This is why I was saying before if you are just running it with the same value for keep_days its really not doing much. You are already purging all data older then 10 days and repacking the DB every night at 4AM. Running the purge service again that same day won’t really have much work to do.
1 Like
I see no changes even after several hours.
Are there any visible signs of “repack is in progress”?
Thanks again for a detailed answer.
Unfortunately, it does not help me.
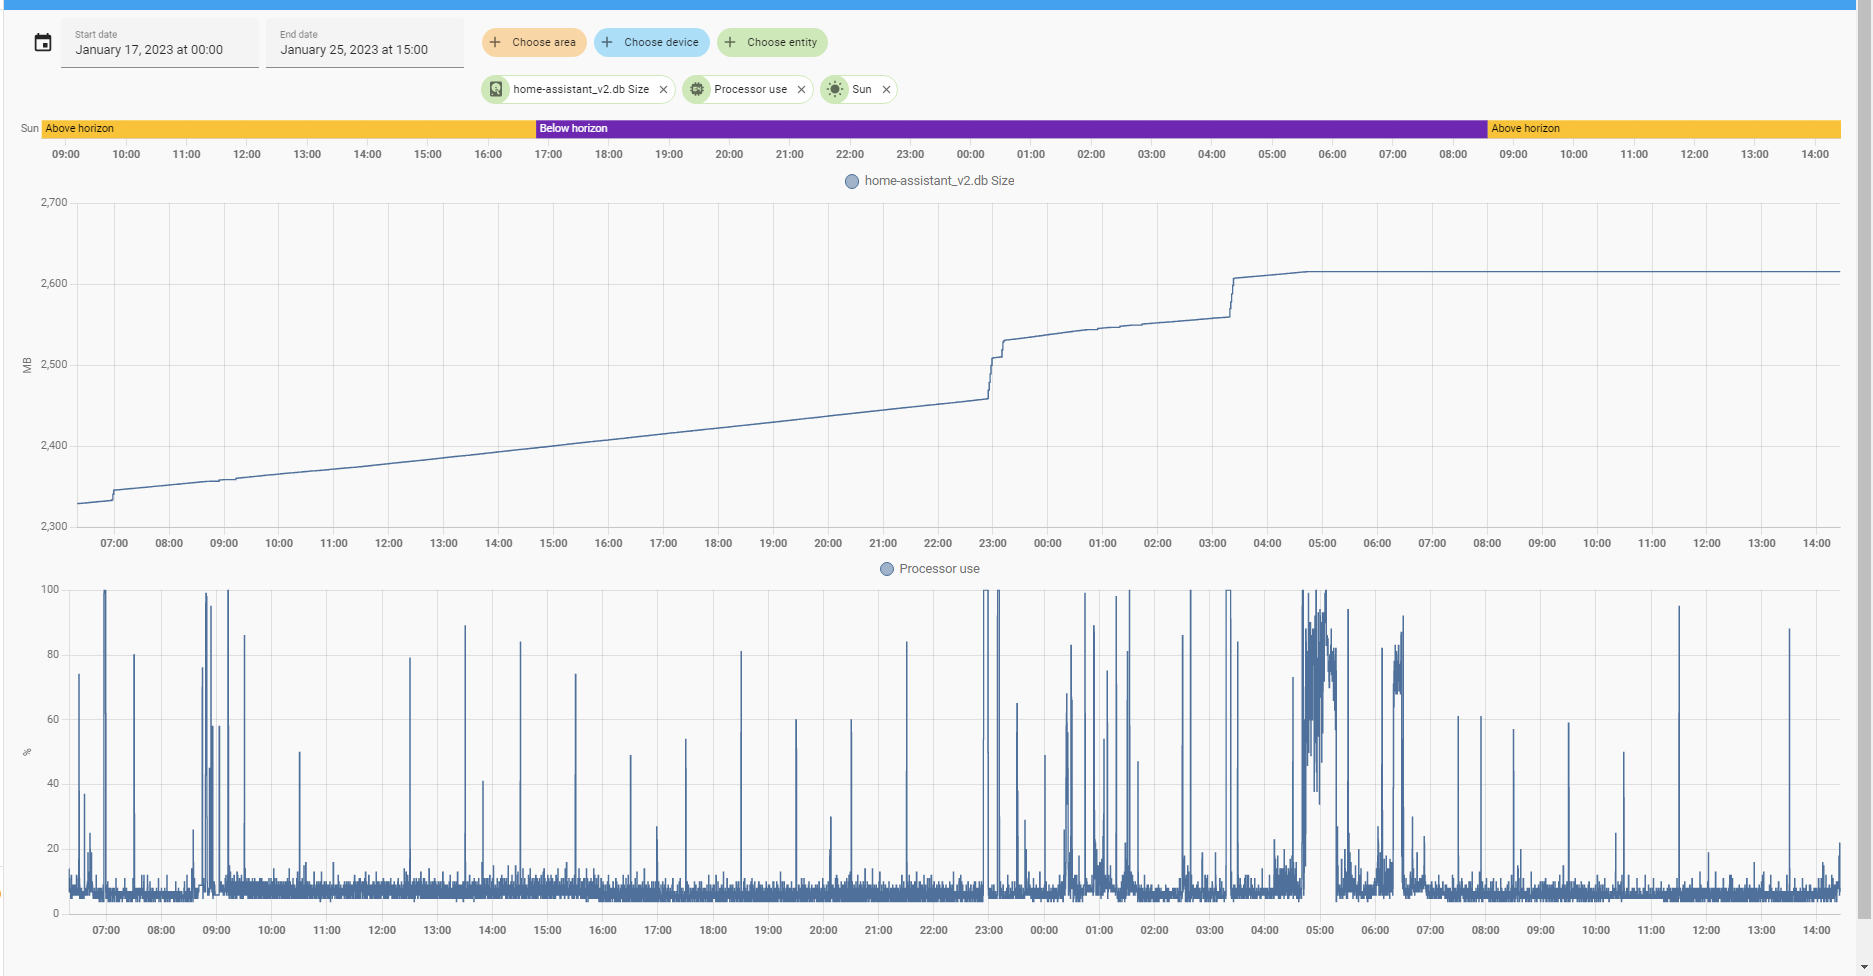
Assume my “normal” file size is 4GB, suddenly it becomes 15GB. Means - some data are recorded.
What are these data related to?
Assume these data are for some entity which was NOT allowed to be recorded. I am 99% sure that this this assumption is wrong: all entities excluded from Recorder cannot produce this rapid and huge increase.
Then assume these data are some “buggy” data; I am not an expert in DB at all, but think that a crash in a db server may cause recording some trash.
So, why I am telling about my problems HERE? Because I believed that the “repack” function may clean DB - remove all trash and leave only needed data. My tests with calling the “purge+repack” service did not succeed, DB size was not restored back to the “normal” size.
I repeat: my posting here is mainly not about “why DB size is increased and what this trash is”, it is about “may I use purge+repack to remove this trash”.
Answering the 1st question is a very complex thing, this is beyond a scope of this thread. Surely I need to eliminate a reason of this “increasing”, but now I just want to learn how to “fix” a DB.
What evidence do you have for this? This seems impossible to me. HA is what tells the DB to add something. If it crashed, what would tell the DB to add a row? There’s essentially only 3 things recorded in the DB from HA:
- Events fired over the bus (exception:
state_changedevents since state changes are different) - Changes in state for entities (including attributes)
- Statistics for entities with numeric states
Almost certainly if your DB is increasingly rapidly you have some integration that is rapid firing state changes at HA. See here for some tips on finding those entities.
That’s not how this works. Repack isn’t an HA thing, its a native database thing. It does not remove any actual user data. That would be a major, major issue because admins do repacks on production databases regularly. It essentially does a clean up, re-organizing data on disk to optimize indices and layout and such. It also does admin things like cleaning up the transaction table (which may remove some data but not user data, internal data). Among other stuff, I don’t really know all it does, I’m not a db expert either.
But the point is it is something HA is triggering in the DB, it is not a process written by HA. Therefore it has absolutely no knowledge of what you have included and excluded in your recorder config, it doesn’t even know what is in the tables. Everything is just bytes to it, it would never delete your stuff.
1 Like
This is a very clear explanation what the repack is. It is like “HDD defragmentation does not delete files, it rearranges them”.
So, my guess about using repack to remove wrongly added data is wrong.
Thanks again.
As for finding a reason of my DB issue - yes, it could be a problem with some integration. As I said, once I disabled almost all integrations but still observed this issue. Will continue to find the reason…
One more thing.
Assume some integration starts recording some entity rapidly. If each record is “marked” with a current timestamp - I believe these rapidly-added data (1000000000 records per day instead of normal 100) should be purged in 10 days - which does not happen in my case, DB size is not decreasing (for instance, 2-3 weeks ago (before 2023.1) DB size suddenly grown from 4GB to 6.7GB and was same these 2-3 weeks).
Ok. I mean there might be a bug but you’d need more proof then that. You’d really need to query the db and find data in there that was recorded even though your filters said not to or was more then 11 days old (since purge runs once a day you’d expect things to live up to 24 hours over the limit until the job can run).
Fwiw my understanding is the fastest way to build up a large db is having a lot of attributes. Particularly changing data in attributes. Because then everytime an attribute changes a row is added with the value of all attributes, even the ones that didn’t change. So if you have frequently changing data in attributes or heavy use of attributes, I’d start looking there. It’s better to bump data that is changing out into its own entity as the state if possible.
2 Likes
I suggest you change your “strategy” to only use Only “Include” in your Recorder settings, by using Exclude ( as you do ) or Exclude+Include then the Recorder might/Will record something you really don’t want it to , because you can’t always “predict” what will happen in your system/configurations/settings.etc.
By only using Include, you tell Recoder to “Record only events / states / state-changes” in/from the list of entities/Domäns you specify in Recorder-Config(conf.yaml)
EDIT: Not entirely truth, HA does apparently records some “system events” regardless of Recorder-settings
By using exclude, Recorder Records everything , but not the entries/domäns you have specified in “exclude”
… And Everything is as it sounds ( you have no/less control ) , an update, whether a ha, or integration could create new entities, services etc, a script/automation/template will create events
If you know which data you want in your DB, You should use “only” Include in your Recorder-settings.
This will minimize the risk that the Recorder (for unknown reasons) fills your DB with garbage
Within last 24 hours started the “purge” service TWICE (with several hours interval):
No reaction, no db file size changes…
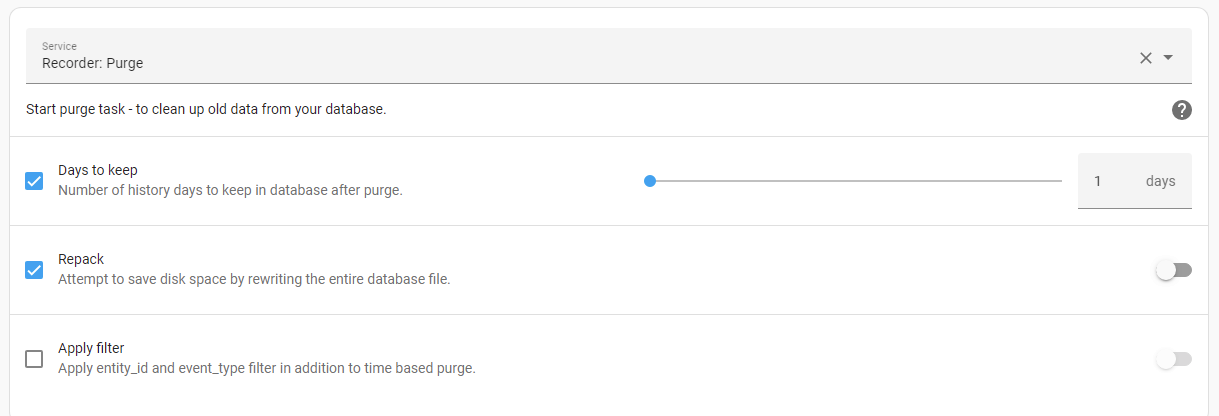
“Days to keep” set to “1 day” - specially to see a difference.
No corresponding records in Log.
BUT - there is no a longer history for entities in History!
An available history starts from “yesterday, 07:00” .
Seems that the History shortened to 1 day.
Then why the db file size is not changed?
Using a standard “filesize” integration; also measured by calling “ls -la”, same file size reported.
Thank you, I need to think about it.
My initial idea was “let all entities have a history by default”; but your proposal has own advantages, need to think…
FWIW, I only include. You add a device with 40 entities, you now have 40 new database entries as soon as you add it. If you only use inclusions, that never happens. It requires a bit more hand holding, but all the include/exclude yaml for entities that ‘record’ use the same yaml shape. So they can all point to the same file with an !include. Then you only manage it in one place.
In your pic above this txt , i see that you “checked” the Repack ; However !, if you look to the right, there is a “Toggle” which you not seems to have “clicked” on “enabled”, so NO Repack have been performed
PS: Don’t ask me why they have made this "2 factor “entanglement” . i’d didn’t see/noticed this the first couple of times, and even after i was aware about it, i have forgotten to click it .( it’s neither intuitive , nor good UX “gimmick”…
( i.e. greyed like it’s not suppose to work, and no txt like “enable” or so … just a greyed (not available ? ) toggle )
Omg, you are right).
But anyway, “purge” should have started - and now I do not observe a file size changed.
Will test again with the “repack on” set.
Imho the file size should have reduced even w/o repack …
Right, this approach has its advantages. As I said before, I will think about it and probably reconsider my way.
It’s like a “Defrag” , Purge remove the “written entries” in the file ( file is still the same size … Repack reclaim free space by re-arrange " bits and bytes " … kind of like that, i honestly don’t know in details
Edit: if you don’t do the Repack, then “new” entries will fill-in, and you initially might see a slight increase, but if nothing else happens in your system, and you have removed alot entries, and configured Recorder to Record less, then eventually your DB-file will decrease, as Recorder does default purge/repack ( so eventually all “old” entries will be gone, and “free” space replaced with new entries,( it’ll take default purge-interval + alitle/alot more ) time, before Recorder have “optimized” the DB-file
Then this is strange.
As it was written before, the “repack” performed automatically not every day.
But file size is kept same due to an automatic “purge” call (04:00).
Probably “purge” only marks all old records as “old” - and then they are overwritten, so a file size is same.
Ok, I think I got the point.
Thanks again for explanations!
Yes maybe, sounds more “correct” than my theory ![]()
In my case, I have a postgresql database installed on a different Raspberry Pi that I use as my database.
On that Pi, I also installed DBeaver, and I can look at the database.
I can do the following commands to see that purge works, it also gives me the entities with the most entries, so I can add those to the purge:
select entity_id, count(*) from states group by entity_id order by count(*) desc;
select count(*) from states;
select pg_database_sze('hass_db');
OK folks, after 41 posts the original questions seems to still be unanswered.
So how to detect a called service: recorder.purge has been finished?
I propose there should at least be an event sent e. g. by the supervisor stating the job has finished.
I’m stuck without knowing this. In my use-case I have a system pressure monitoring automation which shall only trigger in unregular situations (surprising load situations), therefore I excluded all well-known and expected, not interesting load situations (like backups, purge and repack). Now I discovered that this condition used so far is of course not working as the automation is flagged as “not running” but the purge still is running.
condition: not
conditions:
  - condition: numeric_state
    entity_id: automation.system_data_purge_recorder_db
    attribute: current
    above: 0
  - condition: numeric_state
    entity_id: script.system_purge_recorder_db
    attribute: current
    above: 0
1 Like
No one with any idea? Come on, I’m sure HA can do this, right?
What about working with events (which I never did so far) - any potential in there for detecting the finished recorder tasks (purge/repack)?
I gave up on this. There are no events fired for start and stop purging so, when purge starts, it run async without possibility to detect the end.
Maybe someone can fill feature request?