How I finally made TankUtility work with Energy dashboard

I recently had solar installed on my house, so of course I quickly integrated the EnPhase system into the HA Energy dashboard. That motivated me to finally attempt to integrate my TankUtility ( https://tankutility.com/) WiFi propane tank monitor into the Energy dashboard as well. I ran into a number of problems along the way, all based on my lack of understanding of how long-term statistics actually work within HA, and what kinds of sensors and statistics the Energy dashboard requires. Here’s the solution I came up with, written up here in the hope that it will help other folks in similar situations and also that people smarter than myself might help me improve the setup.

The first thing to do, of course, is to integrate the TankUtility monitor into HA. Here’s the entry in my configuration.yaml which does that, exactly the way the documentation for the HA TankUtility integration describes it:

sensor:
  - platform: tank_utility
    email: !secret tank_utility_username
    password: !secret tank_utility_password
    devices:
      - xxxxxxxxxxxxxxxxxxxxxxxx

Where “xxxx…” is the identifier for my TankUtility monitor. In “Developer Options/States” now I can see this:
image

That value is the percentage that the tank is filled, in this case 63.6%. So that value will generally go down over time (though my reading tends to bounce around a little), except when the tank is filled,when it’ll go back up to 80-90% (they don’t fill my kind of large buried propane tank to 100% for safety reasons, or so I’m told).

You can’t add this sensor directly to the Energy dashboard ( Settings/Dashboards/Energy/Add Gas Source ), it won’t even be listed as an available gas source. This is because it’s not a “gas” source, it’s not in the correct units (cubic meters or cubic feet) and more importantly it doesn’t have long-term statistics associated with it yet.

The next thing I did was to create a template sensor which acts as if it is a propane “meter” measuring gas flow into the house:

template:
  - sensor:
        name: "Propane Level"
        unique_id: propane_level
        icon: mdi:fire
        device_class: gas
        state_class: total_increasing
        unit_of_measurement: 'ft³'
        state: "{{ ( states('sensor.tank_utility_xxxxxxxxxxxxxxxxxxxxxxxx') | float * -1.3368 ) + 133.68 }}"

This sensor ranges from zero to 133.68 (hypothetically), resetting to (near) zero when the tank is refilled. If you look at the math in the “state” line, I’m converting the fill value from the TankUtility sensor from percentage to cubic feet (I have a 1000 gallon tank, so I multiply the percentage by 10 to convert to gallons; there are 0.13368 cubic feet per gallon volumetrically, I think I reduced the equation properly?). I also multiplied by -1 to make the propane level continuously increase (flowing “into” the house, for the Energy dashboard)… at least until it drops enormously when the tank is filled. To make that value range above zero (rather than -133.68 cubic feet up to zero and down again) I added the total volume of the tank in cubic feet.

Also notice that “device_class” is set to “gas” (important for the Energy dashboard to recognize it). Also, through some trial and error, I found that I have to set the “state_class” to “total_increasing”. I tried to use the “measurement” state class but kept getting a warning in the Energy dashboard Add Gas Source section that the entity’s “last_reset” wasn’t set. “total_increasing” appears to allow this entity to not need a “last_reset”, and is also apparently a misnomer, in that the documentation says it IS expected to occasionally reset? I’m obviously unclear on this, but in true hobbyist fashion I’m going with “it seems to work!” We’ll see what happens the next time I fill my propane tank. Finally, notice that the unit_of_measurement needs that superscript “3” in there.

This sensor still won’t appear on the Energy dashboard’s Add Gas Source drop-down, because it needs statistics. We can use the utility_meter integration to do that. Here’s my entry in configuration.yaml:

utility_meter:
  daily_propane:
    source: sensor.propane_level
    cycle: daily
  monthly_propane:
    source: sensor.propane_level
    cycle: monthly
  yearly_propane:
    source: sensor.propane_level
    cycle: yearly

NOW you should be able to go into Settings/Dashboards/Energy/Add Gas Source and choose “Propane Level” as your gas source.

image

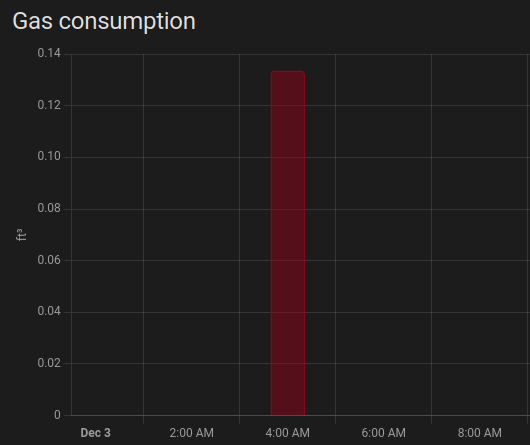
After a day or two (TankUtility homeowner meters only update daily) you’ll start to see Gas consumption and statistics in your Energy dashboard:

image

image

I hope this helps someone! Comments and questions welcome.

3 Likes

This is great! I tried all kinds of permutations to get my tank utility to properly register in HA as an energy source, but it never worked quite right.

Already copied your code over, and I just need to wait for the Tank Utility to update to see if I did it properly.

Update: It works perfectly!

This looks great! Do you still need tank utility’s subscription service?

As far as I know you have to use the Tank Utility Cloud for the product to work - though there were no cloud charges per say. It would be great if this could somehow be set to be local only, but I believe everything gets forwarded to Tank Utility, and HA just gets that back from the cloud.

incase others end up here doing the same thing, here is my attempt to break the formula.

0.01 = convert the whole number percentage into a decimal percentage
500 = My tank 500 size in gallons
35.65 = ft3 per gallon of propane
the formula below produces “Cubic Feet of Propane in Tank”

        state: "{{ ( states('sensor.tank_utility_xxxxxxxxxxx') | float * 0.01 * 500 * 35.65 ) }}"

I think this is correct and it should be easy for other to use this formula on their setup.

edit: I might have the the ratio of ft3 to gallons wrong. https://dec.alaska.gov/media/18793/gasconversionchartpublic.pdf shows that the ratio should be 35.65ft/gallon.
edit: The above equation takes into account of errors that I had with the 35.65

1 Like

According to chatGPT, you have to measure the ft3 in the gaseous state which is 270x the liquid state. That’s how you get to ~35.65

Stupid thing is your right. And I knew that number also. I haven’t a clue why I put that decimal in my equation.

Thanks for the 500 gallon equation; so has it changed from your post on Nov 23rd?

Yes, that equation has been updated with my latest corrections

1 Like

Hello,

It appears this method works with the Mopeka tank sensor too. I still have to get my sensor attached to my tank but the code appears to work.

Would be neat if the tank size could be pulled from the sensor data. I used the same formula but changed it from 500 to 250.

template:
  - sensor:
      name: "Propane Level"
      unique_id: propane_level
      icon: mdi:fire
      device_class: gas
      state_class: total_increasing
      unit_of_measurement: "ft³"
      state: "{{ ( states('sensor.pro_plus_####_tank_level') | float * 0.01 * 250 * 35.65 ) }}"

utility_meter:
  daily_propane:
    source: sensor.propane_level
    cycle: daily
  monthly_propane:
    source: sensor.propane_level
    cycle: monthly
  yearly_propane:
    source: sensor.propane_level
    cycle: yearly

1 Like

So I have HA reporting to the energy dashboard, but not getting the results I would like. Here is the pertinent part of my template: float * 0.01 * 500 * 35.65 (I have a 500 gallon tank).

I have attached the results I’m getting each day.


Screenshot 2024-02-08 at 1.49.35 PM

It appears that it just displays 35.65 each day? So todays update show -107, is there a easy way to convert this to a percentage of 500 gallons of propane?

Thanks once again.

UPDATE: Altered to include capacity from JSON response in calculations.

I wanted to chime in here and thank everyone for their contributions. I too was able to get my Tank Utility data in Energy Dashboard, thanks almost entirely to you all!

I did want to share some of my own configuration, however, as I have been struggling mightily with the built-in Tank Utility integration. It works, but my data has always lagged at least 24 hours, and I also ended up with random dips and spikes. Because of this, I opted to set-up some command_line sensors to automatically poll the Tank Utility API. Please see below…

command_line:
  - sensor:
      name: tank_utility_api_token
      unique_id: tank_utility_api_token
      command: 'curl -u <MyTankUtilityUsernameOmitCarets>:<MyTankUtilityPasswordOmitCarets> https://data.tankutility.com/api/getToken'
      json_attributes:
        - token
      value_template: 'ok'
      scan_interval: 3600
  - sensor:
      name: tank_utility_device_id
      unique_id: tank_utility_device_id
      command: "curl https://data.tankutility.com/api/devices?token={{ state_attr('sensor.tank_utility_api_token', 'token') }}"
      json_attributes:
        - devices
      value_template: '{{ value_json.devices[0] }}'
      scan_interval: 60
  - sensor:
      name: tank_utility_device_level
      unique_id: tank_utility_device_level
      command: "curl https://data.tankutility.com/api/devices/{{ states('sensor.tank_utility_device_id') }}?token={{ state_attr('sensor.tank_utility_api_token', 'token') }}"
      json_attributes:
        - device
      value_template: '{{ value_json.device.lastReading.tank }}'
      scan_interval: 60
      unit_of_measurement: "%"

This will create 3 sensors.

  • A sensor to store the API token, which expires every 24 hours. I am refreshing the token every hour, even though it doesn’t change. The token is stored in the attributes.
  • A sensor containing the device ID of the first device in my account.
  • A sensor containing the tank reading from my device. Additionally, it will contain the entire “device” object from the reponse JSON, so we can access the tank capacity later.

I then created some other template sensors for the purposes of transforming the data, which gets the tank capacity from the response JSON.

template:
  - sensor:
    - name: "Propane Remaining Gallons"
      unique_id: "propane_remaining_gallons"
      state: "{{ (states('sensor.tank_utility_device_level') | float) * 0.01 * state_attr('sensor.tank_utility_device_level', 'device').capacity | float }}"
      unit_of_measurement: "gal"
      icon: mdi:tanker-truck
    - name: "Propane Used Gallons"
      unique_id: "propane_used_gallons"
      state: "{{ state_attr('sensor.tank_utility_device_level', 'device').capacity | float - (states('sensor.propane_remaining_gallons') | float) }}"
      unit_of_measurement: "gal"
      icon: mdi:tanker-truck
    - name: "Propane Used Cu Ft"
      unique_id: "propane_used_cu_ft"
      icon: mdi:fire
      device_class: gas
      state_class: total_increasing
      unit_of_measurement: "ft³"
      state: "{{ (states('sensor.propane_used_gallons') | float) * 35.65 }}"
    - name: "Propane Price/Rate ($/ft³)"
      unique_id: propane_price_cu_ft
      state: "{{ (states('input_number.propane_price') | float) / 35.65 }}"
      unit_of_measurement: "USD/ft³"

You’ll also notice that I entered a price conversion sensor here, as well. I created an Input Number helper so that I can enter my $/gallon of propane, and this will convert it automatically to $/ft³ to be used in the Energy Dashboard.

And then finally, the utility_meter objects, which I didn’t really change aside from assigning unique IDs.

utility_meter:
  daily_propane:
    unique_id: daily_propane_consumed
    source: sensor.propane_used_cu_ft
    cycle: daily
  monthly_propane:
    unique_id: monthly_propane_consumed
    source: sensor.propane_used_cu_ft
    cycle: monthly
  yearly_propane:
    unique_id: yearly_propane_consumed
    source: sensor.propane_used_cu_ft
    cycle: yearly

The only problem (albeit a small one) I still have is that my propane level from my command_line sensors resets to “Unknown” every time I reload the YAML or restart HomeAssistant, and it takes the full minute for it to refresh. If anyone has any ideas of how to perpetuate the last known state OR how to force the command_line sensor to refresh immediately upon startup, I’m all ears.

Additionally, if anyone out there has any experience with REST sensors, I believe it should be possible to use those instead of the command_line/cURL sensors. Please share if you’re able to figure that out, I gave up at 3AM last night…

Anyway, hopefully this is helpful to you all! I found that the manual API querying through command_line cURL commands is MUCH more accurate than the built-in integration. Enjoy!

1 Like

Actually, that’s a really good thought… The capacity is available in the JSON, let me see if I can pull that in as an attribute to use in the sensor calculations. I’ll revise my previous comment with the updated sensor if I’m able to pull it off.

EDIT: Great success! See above!

1 Like

I’m really struggling to understand these readings. I have attached the latest, and the first ‘bar’ at midnight is ‘larger’ but the energy readout showed 17,000 and something, the 2nd ‘bar’ near noon today is ‘smaller’ but the readout shows 25,000 something; I don’t understand?


Screenshot 2024-02-13 at 1.41.32 PM