Hi  !
!
Id use a power entity for that. SolarNet Power Grid for example.
Hi,
Thanks for your answer. SolarNet Power Grid, and then checking if its negative or positive?
Sure. Id probably do a automation that works like a hysteresis logic. Like
on-branch
- turn on above water heating power + ~200 W
- delay for ~ 10 minutes to avoid switching too often (If your water heater doesn’t do that by itself)
off-branch
- turn off on below 0
- delay again
Symos (and probably others too) provide that kind of logic out of the box with their IO Ports. So maybe you don’t need HA at all for that kind of thing.
Hey everyone,
me again. I have switched the total battery charged, discharged and Photovoltaics from the config file to helpers. And it seems to screw up stuff.

According to Fronius app I have used 6,9 from the grid and have zero production as of now.
I have created the helper as Riemansum with left, which as per my understanding should be same as:
sensor:
  - platform: integration
    source: sensor.battery_power_charging
    name: "Total Batterie geladen"
    method: left
  - platform: integration
    source: sensor.battery_power_discharging
    name: "Total Batterie entladen"
    method: left
  - platform: integration
    source: sensor.power_photovoltaics
    name: "Total Photovoltaik"
    method: left
When checking the sneosrs they show the following values:
sensor.total_photovoltaiik: 101,13
sensor.total_batterie_entladen: 0,21
sensor.total_batterie_geladen: 110,46
Any ideas what could cause this error?
Thanks to everyone I have successfully configured a Fronius Gen24 with a BYD battery, Using the custom power flow card (GitHub - ulic75/power-flow-card: A power distribution card inspired by the official Energy Distribution card for Home Assistant) I also have a live view as well.

My advice to anyone still struggling is to go into the integration for each of the Fronius Devices, Turn on any of the “entities not shown” then use ADD TO DASHBOARD to send all the entities to a new dashboard

Then from this dashboard it is much easier to find and match entites to the fronius live view and the energy management screen
The lovelace config is for the live view is:
  - title: mirror
    type: panel
    path: mirror
    badges: []
    cards:
      - type: horizontal-stack
        cards:
          - type: custom:power-flow-card
            title: Energy distribution Now
            kw_decimals: 2
            entities:
              battery: sensor.solarnet_power_battery
              battery_charge: sensor.byd_battery_box_premium_hv_state_of_charge
              grid: sensor.solarnet_power_grid
              solar: sensor.solarnet_power_photovoltaics
            inverted_entities: null

     - title: Energy distribution Today
            type: energy-distribution
            link_dashboard: false
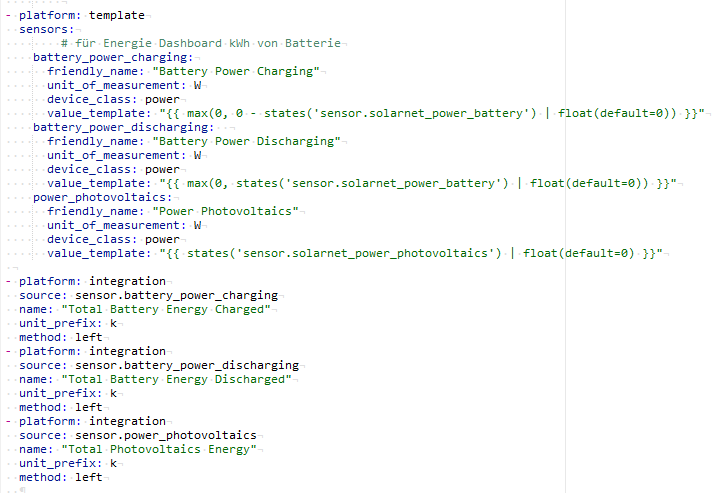
And my configuration.yaml settings
template:
  - sensor:
      - name: "Battery Power Charging"
        unit_of_measurement: W
        device_class: power
        state: "{{ max(0, 0 - states('sensor.solarnet_power_battery') | float(default=0)) }}"
      - name: "Battery Power Discharging"
        unit_of_measurement: W
        device_class: power
        state: "{{ max(0, states('sensor.solarnet_power_battery') | float(default=0)) }}"
      - name: "Power Photovoltaics"
        unit_of_measurement: W
        device_class: power
        state: "{{ states('sensor.solarnet_power_photovoltaics') | float(default=0) }}"


sensor:
  - platform: integration
    source: sensor.battery_power_charging
    name: "Total Battery Energy Charged"
    unit_prefix: k
    method: left
  - platform: integration
    source: sensor.battery_power_discharging
    name: "Total Battery Energy Discharged"
    unit_prefix: k
    method: left
  - platform: integration
    source: sensor.power_photovoltaics
    name: "Total Photovoltaics Energy"
    unit_prefix: k
    method: left
Good Luck!
Hi guys,
can somebody also please post a screenshot of the Riemann Sum variables configuration?
Thank you.
Alex
in the post above, the sensor section has them:
sensor:
  - platform: integration
    source: sensor.battery_power_charging
    name: "Total Battery Energy Charged"
    unit_prefix: k
    method: left
method:
Riemann sum method to be used. Available methods are trapezoidal , left and right .
Hi Jon,
could you please tell me how I can get the daily distribution? I’ve followed your instruction and created the new dashboard, but i don’t know what I should fill in for the daily distribution
do you mean to get the daily and now distribution animations? the “now” is a hacs card called power meter GitHub - ulic75/power-flow-card: A power distribution card inspired by the official Energy Distribution card for Home Assistant
I have it configured like this:
    cards:
      - type: horizontal-stack
        cards:
          - type: custom:power-flow-card
            title: Energy distribution Now
            kw_decimals: 2
            entities:
              battery: sensor.solarnet_power_battery
              battery_charge: sensor.byd_battery_box_premium_hv_state_of_charge
              grid: sensor.solarnet_power_grid
              solar: sensor.solarnet_power_photovoltaics
            inverted_entities: null
The Today reuses the standard energy distribution which you can include by using a card with this:
     - title: Energy distribution Today
            type: energy-distribution
            link_dashboard: false
1 Like
hello, great script but unfortunately something is wrong with me in the HA.
I draw as much power into the battery as I take out of it.
Where is the error?

Check what entities you put into the energy dashboard. My guess, you put twice something.
Hi,
Could someone please provide a complete instruction that I get the Fronius Gen24 to work with BYD battery in home assistance. the instructions above do not work.
Thank you so much!!
2 Likes
Imho the start of this thread is a very complete instruction for that topic. A more broad description can be found at the integration documentation.
If something doesn’t work for you, you’ll have to be more specific about what exact problem you face.
1 Like
Solved
Hello guys,
I was so glad that somebody already worked on that. Thank you @csett86 !
I have a SymoGen24 and just installed BYD batteries.
Solar panel production data is already available from the inverter.
I’m struggling to have the right Power Charging et Discharging entities ready for the Battery system configuration for the Energy Dashboard.
But the list is not suggesting the new power entities. I guess the units are not the one expected.:

Is it just a matter of waiting as the entities were just created or should I adjust anything?
edit:
Hi guys,
I went through the whole thread and the point about difference between Power and Energy and the comment about the helpers … helped me a lot:
I created helpers of type “Integration Riemann” and provided the Power Dis/Charging sensor mentioned above and the Energy entity was created:

I still have to wait that the battery discharge to have the Discharge entity get filled with data.
I put twice the Charge entity in the meantime.
Thanks guys for the precious help and data you put in the threads. It helps even months after ![]()
Tim
Hello Together
I have set up my Energy dashboard and at first glance everything is working. But on closer inspection, I got out of the battery about 18kWh (in 364,5kWH / out 382,8kWh / month) more than went in. Does anyone have an explanation for this?
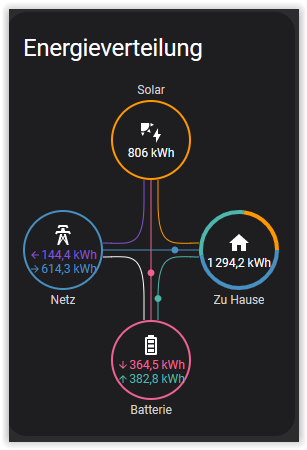
I am grateful for any help
Greetings from Switzerland
Hello,
Is it everyday or a total for a week or month?
Because you may have bad data in your stats if you played with it before getting it right.
Tim
Thank you for your feedback
It is not always the same. There are days when the two values are identical. But there are days when the values are completely different. Per day, of course, relatively little, but in total it makes a difference. Especially when the daily values are combined into weekly or monthly values.
I noticed that the battery is normally only charged to 7%. Now I have noticed that sometimes during the night the battery is charged to 3-4% and then charged again during the night to 7%. Therefore, I can currently imagine that the difference comes from “charging at night”. What do you think about my theory?
Also, I had not created the total solar generation sensor in yaml. Now I have done so and I am curious to see whether this might contribute to the improvement or not.
Kind regards
Markus
What seems not a coincidence, is that the difference you get from in an out is the size of your battery: 18kWh.
If you started measuring since the beginning and you installed and fully loaded battery, then it seems correct that you will always have the extra 18kWh that you got from the beginning.
Does it make sense to you?
Hello TimMayle
good observation 
I don’t know if it is because of that. I have been running the battery for a year now and the picture is from March. I am watching it now for a week to see how it behaves after I created the total solar generation in yaml.
Thanks for your support
EDIT:
Solved, wrong formatting of config yaml on my side! :-/
Hello everyone,
I have setup the energy dashboard and my yaml according the starting post.
The live view is working with the power-flow-card:
But in the energy Dashboard I always got and error with the photovoltaics and battery that my entities are not defined:

So in the Energy Dashboard, either Solar nor Battery are counting.
Has someone a solution for that maybe?
Thanks!
EDIT:
Solved, wrong formatting of config yaml on my side! :-/