Hydrific Droplet

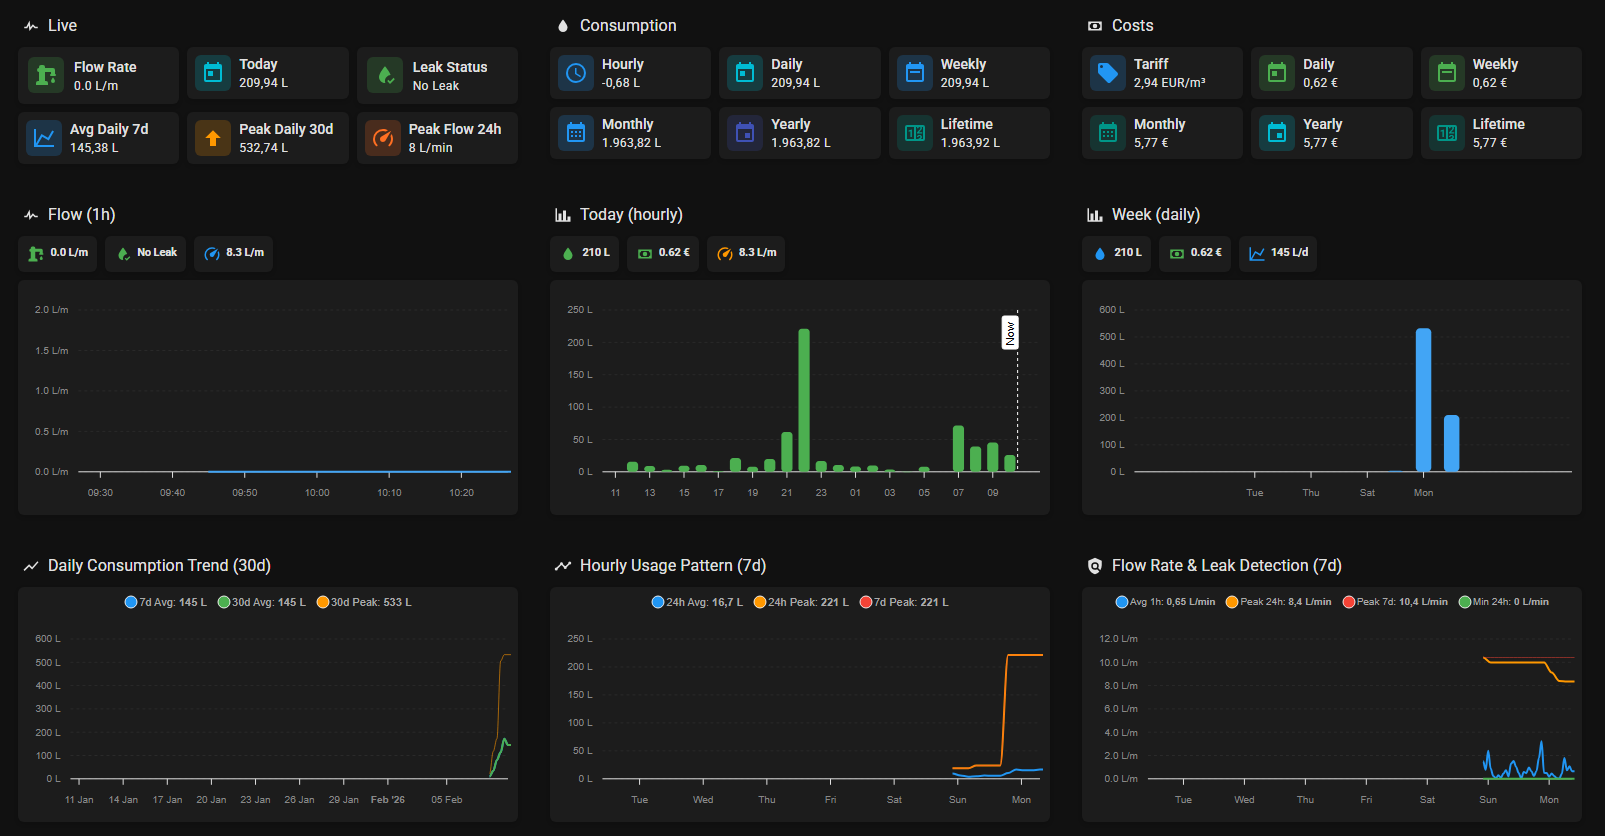
I finalized the package with all the bells & whistles. Then I created a dashboard, while waiting for the superbowl:

And in case someone needs it:

Package Code
# Mains Water Meter Package v3
# by @alexdelprete (Feb 2025)

input_number:
  mains_water_tariff:
    name: "Mains Water Tariff"
    icon: mdi:cash
    unit_of_measurement: "EUR/m³"  # ← Change to your currency/unit
    min: 0
    max: 100
    step: 0.01
    initial: 2.94

# =============================================================================
# UTILITY METERS
# Track consumption per calendar period (resets at midnight/week/month/year)
# Change the source sensor on the first entry below (&water_source)
# All other entries will automatically use the same sensor (*water_source)
#
# Entity IDs will be: sensor.mains_water_hourly, sensor.mains_water_daily, etc.
# =============================================================================

utility_meter:
  mains_water_hourly:
    source: &water_source sensor.droplet_water  # ← CHANGE THIS TO YOUR WATER SENSOR
    name: "Mains Water Hourly"
    unique_id: mains_water_um_hourly
    cycle: hourly
    delta_values: true
    net_consumption: true
    always_available: true

  mains_water_daily:
    source: *water_source
    name: "Mains Water Daily"
    unique_id: mains_water_um_daily
    cycle: daily
    delta_values: true
    net_consumption: true
    always_available: true

  mains_water_weekly:
    source: *water_source
    name: "Mains Water Weekly"
    unique_id: mains_water_um_weekly
    cycle: weekly
    delta_values: true
    net_consumption: true
    always_available: true

  mains_water_monthly:
    source: *water_source
    name: "Mains Water Monthly"
    unique_id: mains_water_um_monthly
    cycle: monthly
    delta_values: true
    net_consumption: true
    always_available: true

  mains_water_yearly:
    source: *water_source
    name: "Mains Water Yearly"
    unique_id: mains_water_um_yearly
    cycle: yearly
    delta_values: true
    net_consumption: true
    always_available: true

# =============================================================================
# STATISTICS SENSORS
# Rolling window analytics for trends, patterns, and anomaly detection
#
# Change the flow rate sensor on the first flow entry (&flow_source)
# Utility meter sources are fixed (they reference entities created above)
# =============================================================================

sensor:
  # ---------------------------------------------------------------------------
  # DAILY CONSUMPTION STATISTICS
  # Source: utility meter that resets at midnight
  # ---------------------------------------------------------------------------

  # Average daily consumption over the past week
  # Use: "What's my typical daily usage?" - baseline for comparison
  # Alert idea: notify if today's usage exceeds 150% of this value
  - platform: statistics
    name: "Mains Water Avg Daily (7d)"
    unique_id: mains_water_stats_avg_daily_7d
    entity_id: &daily_source sensor.mains_water_daily
    state_characteristic: mean
    max_age: &age_7d
      days: 7

  # Average daily consumption over the past month
  # Use: long-term baseline, seasonal comparison, billing estimate
  # More stable than 7d average, smooths out weekday/weekend differences
  - platform: statistics
    name: "Mains Water Avg Daily (30d)"
    unique_id: mains_water_stats_avg_daily_30d
    entity_id: *daily_source
    state_characteristic: mean
    max_age: &age_30d
      days: 30

  # Highest single-day consumption in the past month
  # Use: identify high-usage events (guests, garden watering, pool fill)
  # Helps set realistic alert thresholds
  - platform: statistics
    name: "Mains Water Peak Daily (30d)"
    unique_id: mains_water_stats_peak_daily_30d
    entity_id: *daily_source
    state_characteristic: value_max
    max_age: *age_30d

  # ---------------------------------------------------------------------------
  # HOURLY CONSUMPTION STATISTICS
  # Source: utility meter that resets every hour
  # ---------------------------------------------------------------------------

  # Average hourly consumption over the past 24 hours
  # Use: "How much am I using per hour on average?"
  # Useful for understanding daily patterns
  - platform: statistics
    name: "Mains Water Avg Hourly (24h)"
    unique_id: mains_water_stats_avg_hourly_24h
    entity_id: &hourly_source sensor.mains_water_hourly
    state_characteristic: mean
    max_age: &age_24h
      hours: 24

  # Highest single-hour consumption today
  # Use: identify peak usage hours (morning shower, dinner prep)
  # Helps understand when water demand is highest
  - platform: statistics
    name: "Mains Water Peak Hourly (24h)"
    unique_id: mains_water_stats_peak_hourly_24h
    entity_id: *hourly_source
    state_characteristic: value_max
    max_age: *age_24h

  # Highest single-hour consumption this week
  # Use: detect unusual high-consumption events
  # Alert idea: notify if current hour exceeds this by large margin
  - platform: statistics
    name: "Mains Water Peak Hourly (7d)"
    unique_id: mains_water_stats_peak_hourly_7d
    entity_id: *hourly_source
    state_characteristic: value_max
    max_age: *age_7d

  # ---------------------------------------------------------------------------
  # FLOW RATE STATISTICS
  # Source: instantaneous flow rate sensor (L/min)
  # Unlike consumption, this measures how fast water is flowing RIGHT NOW
  # ---------------------------------------------------------------------------

  # Highest flow rate observed in the past 24 hours
  # Use: identify max simultaneous demand (multiple fixtures at once)
  # Helps with pipe sizing and pressure considerations
  - platform: statistics
    name: "Mains Water Peak Flow (24h)"
    unique_id: mains_water_stats_peak_flow_24h
    entity_id: &flow_source sensor.droplet_flow_rate  # ← CHANGE THIS TO YOUR FLOW SENSOR
    state_characteristic: value_max
    max_age: *age_24h

  # Highest flow rate observed in the past week
  # Use: understand maximum demand patterns over longer period
  # Useful for plumbing capacity planning
  - platform: statistics
    name: "Mains Water Peak Flow (7d)"
    unique_id: mains_water_stats_peak_flow_7d
    entity_id: *flow_source
    state_characteristic: value_max
    max_age: *age_7d

  # Average flow rate over the past hour
  # Use: smoothed view of recent activity
  # High value = sustained water use; low = intermittent or no use
  - platform: statistics
    name: "Mains Water Avg Flow (1h)"
    unique_id: mains_water_stats_avg_flow_1h
    entity_id: *flow_source
    state_characteristic: mean
    max_age: &age_1h
      hours: 1

  # Minimum flow rate observed in the past 24 hours
  # Use: LEAK DETECTION - if minimum > 0, water is always flowing
  # Alert idea: if min_flow > 0 for extended period (especially at night),
  # there may be a leak (dripping tap, running toilet, pipe leak)
  - platform: statistics
    name: "Mains Water Min Flow (24h)"
    unique_id: mains_water_stats_min_flow_24h
    entity_id: *flow_source
    state_characteristic: value_min
    max_age: *age_24h

# =============================================================================
# LIFETIME ACCUMULATOR
# =============================================================================
# Trigger-based sensor that accumulates all water consumption since creation.
# Never resets - suitable for Energy Dashboard as primary water sensor.
#
# How it works:
#   - Triggers on every sensor.droplet_water state change
#   - Adds the delta (trigger.to_state.state) to current total (this.state)
#   - Persists via core.restore_state across HA restarts
#
# Calibration: Use Developer Tools → States to set initial value if needed
# =============================================================================

template:
  - trigger:
      - platform: state
        entity_id: sensor.droplet_water  # Same source as utility meters
        not_to: [unavailable, unknown]
    sensor:
      - name: "Mains Water Lifetime"
        unique_id: mains_water_lifetime
        state: >
          {{ (this.state | float(0) + trigger.to_state.state | float(0)) | round(2) }}
        state_class: total
        device_class: water
        unit_of_measurement: "L"

# =============================================================================
# COST SENSORS
# =============================================================================
# Cost calculation assumes:
#   - Source sensor reports in LITERS (L)
#   - Tariff is per CUBIC METER (m³)
#   - Divisor is 1000 (1 m³ = 1000 L)
#
# Adjust divisor for your local billing unit:
#   | Tariff Unit | Divisor |
#   |-------------|---------|
#   | /m³         | 1000    |
#   | /gal        | 3.78541 |
#   | /CCF        | 2831.68 |
#
# Currency must be explicitly set via unit_of_measurement (template sensors
# do NOT inherit from HA system settings despite device_class: monetary).
# Change "EUR" below to match your currency code.
#
# To find your currency code, check:
#   Settings → System → General → Currency
# =============================================================================

  - sensor:
      # Today's water cost so far
      # Use: daily spending awareness, budget tracking
      # Resets at midnight with the daily utility meter
      - name: "Mains Water Daily Cost"
        unique_id: mains_water_cost_daily
        device_class: monetary
        state_class: total
        unit_of_measurement: "EUR"
        icon: mdi:cash
        state: "{{ ((states('sensor.mains_water_daily') | float(0)) / 1000 * (states('input_number.mains_water_tariff') | float(0))) | round(2) }}"
        availability: "{{ states('sensor.mains_water_daily') not in ['unknown', 'unavailable'] }}"

      # This week's water cost so far
      # Use: weekly budget tracking, week-over-week comparison
      # Resets on Monday at midnight
      - name: "Mains Water Weekly Cost"
        unique_id: mains_water_cost_weekly
        device_class: monetary
        state_class: total
        unit_of_measurement: "EUR"
        icon: mdi:cash
        state: "{{ ((states('sensor.mains_water_weekly') | float(0)) / 1000 * (states('input_number.mains_water_tariff') | float(0))) | round(2) }}"
        availability: "{{ states('sensor.mains_water_weekly') not in ['unknown', 'unavailable'] }}"

      # This month's water cost so far
      # Use: billing estimate, compare to utility bill, monthly budget
      # Resets on the 1st of each month at midnight
      - name: "Mains Water Monthly Cost"
        unique_id: mains_water_cost_monthly
        device_class: monetary
        state_class: total
        unit_of_measurement: "EUR"
        icon: mdi:cash
        state: "{{ ((states('sensor.mains_water_monthly') | float(0)) / 1000 * (states('input_number.mains_water_tariff') | float(0))) | round(2) }}"
        availability: "{{ states('sensor.mains_water_monthly') not in ['unknown', 'unavailable'] }}"

      # This year's water cost so far
      # Use: annual spending overview, year-over-year comparison
      # Resets on January 1st at midnight
      - name: "Mains Water Yearly Cost"
        unique_id: mains_water_cost_yearly
        device_class: monetary
        state_class: total
        unit_of_measurement: "EUR"
        icon: mdi:cash
        state: "{{ ((states('sensor.mains_water_yearly') | float(0)) / 1000 * (states('input_number.mains_water_tariff') | float(0))) | round(2) }}"
        availability: "{{ states('sensor.mains_water_yearly') not in ['unknown', 'unavailable'] }}"

      # Lifetime water cost (never resets)
      # Use: total spending since meter installation
      # Note: this replaces the broken auto-generated Energy Dashboard cost sensor
      - name: "Mains Water Lifetime Cost"
        unique_id: mains_water_cost_lifetime
        device_class: monetary
        state_class: total
        unit_of_measurement: "EUR"
        icon: mdi:cash
        state: "{{ ((states('sensor.mains_water_lifetime') | float(0)) / 1000 * (states('input_number.mains_water_tariff') | float(0))) | round(2) }}"
        availability: "{{ states('sensor.mains_water_lifetime') not in ['unknown', 'unavailable'] }}"

Since the post was too long to contain both, here’s the Dashboard code:

Dashboard Code
views:
  - type: sections
    title: Water
    path: water
    icon: mdi:water
    max_columns: 3
    sections:
      - type: grid
        cards:
          - type: heading
            heading: Live
            heading_style: title
            icon: mdi:pulse
          - type: grid
            columns: 3
            square: false
            cards:
              - type: custom:mushroom-template-card
                entity: sensor.droplet_flow_rate
                icon: mdi:water-pump
                primary: Flow Rate
                secondary: '{{ states(''sensor.droplet_flow_rate'') }} L/m'
                layout: horizontal
                color: >-
                  {{ 'blue' if states('sensor.droplet_flow_rate') | float > 0
                  else 'green' }}
                tap_action:
                  action: more-info
                icon_tap_action:
                  action: more-info
              - type: custom:mushroom-entity-card
                entity: sensor.mains_water_daily
                icon: mdi:calendar-today
                icon_color: cyan
                name: Today
                layout: horizontal
              - type: custom:mushroom-template-card
                entity: sensor.mains_water_min_flow_24h
                icon: >-
                  {{ 'mdi:water-check' if
                  states('sensor.mains_water_min_flow_24h') | float == 0 else
                  'mdi:water-alert' }}
                primary: Leak Status
                secondary: >-
                  {{ 'No Leak' if states('sensor.mains_water_min_flow_24h') |
                  float == 0 else 'Leak!' }}
                layout: horizontal
                color: >-
                  {{ 'green' if states('sensor.mains_water_min_flow_24h') |
                  float == 0 else 'red' }}
                tap_action:
                  action: more-info
                icon_tap_action:
                  action: more-info
              - type: custom:mushroom-entity-card
                entity: sensor.mains_water_avg_daily_7d
                icon: mdi:chart-line
                icon_color: blue
                name: Avg Daily 7d
                layout: horizontal
              - type: custom:mushroom-entity-card
                entity: sensor.mains_water_peak_daily_30d
                icon: mdi:arrow-up-bold
                icon_color: orange
                name: Peak Daily 30d
                layout: horizontal
              - type: custom:mushroom-entity-card
                entity: sensor.mains_water_peak_flow_24h
                icon: mdi:speedometer
                icon_color: deep-orange
                name: Peak Flow 24h
                layout: horizontal
      - type: grid
        cards:
          - type: heading
            heading: Consumption
            heading_style: title
            icon: mdi:water
          - type: grid
            columns: 3
            square: false
            cards:
              - type: custom:mushroom-entity-card
                entity: sensor.mains_water_hourly
                icon: mdi:clock-outline
                name: Hourly
                layout: horizontal
              - type: custom:mushroom-entity-card
                entity: sensor.mains_water_daily
                icon: mdi:calendar-today
                icon_color: cyan
                name: Daily
                layout: horizontal
              - type: custom:mushroom-entity-card
                entity: sensor.mains_water_weekly
                icon: mdi:calendar-week
                name: Weekly
                layout: horizontal
              - type: custom:mushroom-entity-card
                entity: sensor.mains_water_monthly
                icon: mdi:calendar-month
                icon_color: blue
                name: Monthly
                layout: horizontal
              - type: custom:mushroom-entity-card
                entity: sensor.mains_water_yearly
                icon: mdi:calendar
                icon_color: indigo
                name: Yearly
                layout: horizontal
              - type: custom:mushroom-entity-card
                entity: sensor.mains_water_lifetime
                icon: mdi:counter
                icon_color: teal
                name: Lifetime
                layout: horizontal
      - type: grid
        cards:
          - type: heading
            heading: Costs
            heading_style: title
            icon: mdi:cash
          - type: grid
            columns: 3
            square: false
            cards:
              - type: custom:mushroom-entity-card
                entity: input_number.mains_water_tariff
                icon: mdi:tag
                name: Tariff
                layout: horizontal
              - type: custom:mushroom-entity-card
                entity: sensor.mains_water_daily_cost
                icon: mdi:calendar-today
                icon_color: green
                name: Daily
                layout: horizontal
              - type: custom:mushroom-entity-card
                entity: sensor.mains_water_weekly_cost
                icon: mdi:calendar-week
                icon_color: green
                name: Weekly
                layout: horizontal
              - type: custom:mushroom-entity-card
                entity: sensor.mains_water_monthly_cost
                icon: mdi:calendar-month
                icon_color: teal
                name: Monthly
                layout: horizontal
              - type: custom:mushroom-entity-card
                entity: sensor.mains_water_yearly_cost
                icon: mdi:calendar
                icon_color: cyan
                name: Yearly
                layout: horizontal
              - type: custom:mushroom-entity-card
                entity: sensor.mains_water_lifetime_cost
                icon: mdi:counter
                icon_color: teal
                name: Lifetime
                layout: horizontal
      - type: grid
        cards:
          - type: heading
            heading: Flow (1h)
            heading_style: title
            icon: mdi:pulse
          - type: custom:mushroom-chips-card
            chips:
              - type: template
                icon: mdi:water-pump
                content: '{{ states(''sensor.droplet_flow_rate'') }} L/m'
                icon_color: >-
                  {{ 'blue' if states('sensor.droplet_flow_rate') | float > 0
                  else 'green' }}
                tap_action:
                  action: more-info
                  entity: sensor.droplet_flow_rate
              - type: template
                icon: >-
                  {{ 'mdi:water-check' if
                  states('sensor.mains_water_min_flow_24h') | float == 0 else
                  'mdi:water-alert' }}
                content: >-
                  {{ 'No Leak' if states('sensor.mains_water_min_flow_24h') |
                  float == 0 else 'Leak!' }}
                icon_color: >-
                  {{ 'green' if states('sensor.mains_water_min_flow_24h') |
                  float == 0 else 'red' }}
                tap_action:
                  action: more-info
                  entity: sensor.mains_water_min_flow_24h
              - type: template
                icon: mdi:speedometer
                content: >-
                  {{ states('sensor.mains_water_peak_flow_24h') | float(0) |
                  round(1) }} L/m
                icon_color: blue
                tap_action:
                  action: more-info
                  entity: sensor.mains_water_peak_flow_24h
          - type: custom:apexcharts-card
            graph_span: 1h
            update_interval: 10s
            header:
              show: false
            now:
              show: true
              color: '#ffffff40'
              label: Now
            series:
              - entity: sensor.droplet_flow_rate
                name: Flow rate
                color: '#42A5F5'
                stroke_width: 2
                fill_raw: last
                extend_to: now
                group_by:
                  func: avg
                  duration: 30s
                float_precision: 1
                type: area
            apex_config:
              chart:
                height: 220
              stroke:
                curve: smooth
              yaxis:
                min: 0
                show: true
                labels:
                  style:
                    colors: '#888'
                    fontSize: 10px
                  formatter: EVAL:function(val) { return val.toFixed(1) + ' L/m' }
                axisBorder:
                  show: false
                axisTicks:
                  show: false
              xaxis:
                labels:
                  style:
                    colors: '#888'
                    fontSize: 10px
                  datetimeFormatter:
                    minute: HH:mm
              grid:
                show: true
                borderColor: '#ffffff10'
                strokeDashArray: 3
                yaxis:
                  lines:
                    show: true
                xaxis:
                  lines:
                    show: false
              tooltip:
                enabled: true
                theme: dark
                'y':
                  formatter: EVAL:function(val) { return val.toFixed(2) + ' L/m' }
              fill:
                type: solid
                opacity: 0.12
      - type: grid
        cards:
          - type: heading
            heading: Today (hourly)
            heading_style: title
            icon: mdi:chart-bar
          - type: custom:mushroom-chips-card
            chips:
              - type: template
                icon: mdi:water
                content: >-
                  {{ '{:,.0f}'.format(states('sensor.mains_water_daily') |
                  float(0)) | replace(',', '.') }} L
                icon_color: green
                tap_action:
                  action: more-info
                  entity: sensor.mains_water_daily
              - type: template
                icon: mdi:cash
                content: >-
                  {{ states('sensor.mains_water_daily_cost') | float(0) |
                  round(2) }} €
                icon_color: green
                tap_action:
                  action: more-info
                  entity: sensor.mains_water_daily_cost
              - type: template
                icon: mdi:speedometer
                content: >-
                  {{ states('sensor.mains_water_peak_flow_24h') | float(0) |
                  round(1) }} L/m
                icon_color: orange
                tap_action:
                  action: more-info
                  entity: sensor.mains_water_peak_flow_24h
          - type: custom:apexcharts-card
            graph_span: 24h
            span:
              end: hour
            header:
              show: false
            now:
              show: true
              color: '#ffffff40'
              label: Now
            series:
              - entity: sensor.mains_water_hourly
                name: Water
                color: '#4CAF50'
                type: column
                statistics:
                  type: state
                  period: hour
                  align: end
                show:
                  legend_value: false
                float_precision: 1
            apex_config:
              chart:
                height: 220
              plotOptions:
                bar:
                  borderRadius: 3
                  columnWidth: 65%
                  dataLabels:
                    position: top
              dataLabels:
                enabled: true
                formatter: >-
                  EVAL:function(val) { return val > 0 ? val.toFixed(0) + 'L' :
                  '' }
                offsetY: -18
                style:
                  fontSize: 10px
                  colors:
                    - '#aaa'
              yaxis:
                min: 0
                show: true
                labels:
                  style:
                    colors: '#888'
                    fontSize: 10px
                  formatter: EVAL:function(val) { return val.toFixed(0) + ' L' }
                axisBorder:
                  show: false
                axisTicks:
                  show: false
              xaxis:
                labels:
                  style:
                    colors: '#888'
                    fontSize: 10px
                  datetimeFormatter:
                    hour: HH
              grid:
                show: true
                borderColor: '#ffffff10'
                strokeDashArray: 3
                yaxis:
                  lines:
                    show: true
                xaxis:
                  lines:
                    show: false
              tooltip:
                enabled: true
                theme: dark
                'y':
                  formatter: EVAL:function(val) { return val.toFixed(1) + ' L' }
      - type: grid
        cards:
          - type: heading
            heading: Week (daily)
            heading_style: title
            icon: mdi:chart-bar
          - type: custom:mushroom-chips-card
            chips:
              - type: template
                icon: mdi:water
                content: >-
                  {{ '{:,.0f}'.format(states('sensor.mains_water_weekly') |
                  float(0)) | replace(',', '.') }} L
                icon_color: blue
                tap_action:
                  action: more-info
                  entity: sensor.mains_water_weekly
              - type: template
                icon: mdi:cash
                content: >-
                  {{ states('sensor.mains_water_weekly_cost') | float(0) |
                  round(2) }} €
                icon_color: green
                tap_action:
                  action: more-info
                  entity: sensor.mains_water_weekly_cost
              - type: template
                icon: mdi:chart-line
                content: >-
                  {{ '{:,.0f}'.format(states('sensor.mains_water_avg_daily_7d')
                  | float(0)) | replace(',', '.') }} L/d
                icon_color: blue
                tap_action:
                  action: more-info
                  entity: sensor.mains_water_avg_daily_7d
          - type: custom:apexcharts-card
            graph_span: 7d
            span:
              end: day
            header:
              show: false
            series:
              - entity: sensor.mains_water_daily
                name: Water
                color: '#42A5F5'
                type: column
                statistics:
                  type: state
                  period: day
                  align: end
                show:
                  legend_value: false
                float_precision: 0
            apex_config:
              chart:
                height: 220
              plotOptions:
                bar:
                  borderRadius: 4
                  columnWidth: 55%
                  dataLabels:
                    position: top
              dataLabels:
                enabled: true
                formatter: >-
                  EVAL:function(val) { return val > 0 ? val.toFixed(0) + ' L' :
                  '' }
                offsetY: -18
                style:
                  fontSize: 11px
                  colors:
                    - '#aaa'
              yaxis:
                min: 0
                show: true
                labels:
                  style:
                    colors: '#888'
                    fontSize: 10px
                  formatter: EVAL:function(val) { return val.toFixed(0) + ' L' }
                axisBorder:
                  show: false
                axisTicks:
                  show: false
              xaxis:
                labels:
                  style:
                    colors: '#888'
                    fontSize: 10px
                  datetimeFormatter:
                    day: ddd
              grid:
                show: true
                borderColor: '#ffffff10'
                strokeDashArray: 3
                yaxis:
                  lines:
                    show: true
                xaxis:
                  lines:
                    show: false
              tooltip:
                enabled: true
                theme: dark
                'y':
                  formatter: EVAL:function(val) { return val.toFixed(0) + ' L' }
      - type: grid
        cards:
          - type: heading
            heading: Daily Consumption Trend (30d)
            heading_style: title
            icon: mdi:chart-line-variant
          - type: custom:apexcharts-card
            graph_span: 30d
            header:
              show: false
            now:
              show: true
              color: '#ffffff40'
              label: Now
            series:
              - entity: sensor.mains_water_avg_daily_7d
                name: 7d Avg
                color: '#2196F3'
                stroke_width: 2
                fill_raw: last
                extend_to: now
                group_by:
                  func: avg
                  duration: 6h
                float_precision: 0
              - entity: sensor.mains_water_avg_daily_30d
                name: 30d Avg
                color: '#4CAF50'
                stroke_width: 2
                fill_raw: last
                extend_to: now
                group_by:
                  func: avg
                  duration: 6h
                float_precision: 0
              - entity: sensor.mains_water_peak_daily_30d
                name: 30d Peak
                color: '#FF9800'
                stroke_width: 1
                opacity: 0.6
                fill_raw: last
                extend_to: now
                group_by:
                  func: max
                  duration: 6h
                float_precision: 0
            apex_config:
              chart:
                height: 220
              stroke:
                curve: smooth
              legend:
                show: true
                position: top
                fontSize: 11px
                labels:
                  colors: '#aaa'
              yaxis:
                min: 0
                show: true
                labels:
                  style:
                    colors: '#888'
                    fontSize: 10px
                  formatter: EVAL:function(val) { return val.toFixed(0) + ' L' }
                axisBorder:
                  show: false
                axisTicks:
                  show: false
              xaxis:
                labels:
                  style:
                    colors: '#888'
                    fontSize: 10px
                  datetimeFormatter:
                    day: dd MMM
              grid:
                show: true
                borderColor: '#ffffff10'
                strokeDashArray: 3
                yaxis:
                  lines:
                    show: true
                xaxis:
                  lines:
                    show: false
              tooltip:
                enabled: true
                theme: dark
                'y':
                  formatter: EVAL:function(val) { return val.toFixed(0) + ' L' }
      - type: grid
        cards:
          - type: heading
            heading: Hourly Usage Pattern (7d)
            heading_style: title
            icon: mdi:chart-timeline-variant
          - type: custom:apexcharts-card
            graph_span: 7d
            header:
              show: false
            now:
              show: true
              color: '#ffffff40'
              label: Now
            series:
              - entity: sensor.mains_water_avg_hourly_24h
                name: 24h Avg
                color: '#2196F3'
                stroke_width: 2
                fill_raw: last
                extend_to: now
                group_by:
                  func: avg
                  duration: 3h
                float_precision: 1
              - entity: sensor.mains_water_peak_hourly_24h
                name: 24h Peak
                color: '#FF9800'
                stroke_width: 2
                fill_raw: last
                extend_to: now
                group_by:
                  func: max
                  duration: 3h
                float_precision: 0
              - entity: sensor.mains_water_peak_hourly_7d
                name: 7d Peak
                color: '#F44336'
                stroke_width: 1
                opacity: 0.5
                fill_raw: last
                extend_to: now
                group_by:
                  func: max
                  duration: 3h
                float_precision: 0
            apex_config:
              chart:
                height: 220
              stroke:
                curve: smooth
              legend:
                show: true
                position: top
                fontSize: 11px
                labels:
                  colors: '#aaa'
              yaxis:
                min: 0
                show: true
                labels:
                  style:
                    colors: '#888'
                    fontSize: 10px
                  formatter: EVAL:function(val) { return val.toFixed(0) + ' L' }
                axisBorder:
                  show: false
                axisTicks:
                  show: false
              xaxis:
                labels:
                  style:
                    colors: '#888'
                    fontSize: 10px
                  datetimeFormatter:
                    day: ddd
              grid:
                show: true
                borderColor: '#ffffff10'
                strokeDashArray: 3
                yaxis:
                  lines:
                    show: true
                xaxis:
                  lines:
                    show: false
              tooltip:
                enabled: true
                theme: dark
                'y':
                  formatter: EVAL:function(val) { return val.toFixed(1) + ' L' }
      - type: grid
        cards:
          - type: heading
            heading: Flow Rate & Leak Detection (7d)
            heading_style: title
            icon: mdi:shield-search
          - type: custom:apexcharts-card
            graph_span: 7d
            header:
              show: false
            now:
              show: true
              color: '#ffffff40'
              label: Now
            series:
              - entity: sensor.mains_water_avg_flow_1h
                name: Avg 1h
                color: '#2196F3'
                stroke_width: 2
                fill_raw: last
                extend_to: now
                group_by:
                  func: avg
                  duration: 1h
                float_precision: 2
              - entity: sensor.mains_water_peak_flow_24h
                name: Peak 24h
                color: '#FF9800'
                stroke_width: 2
                fill_raw: last
                extend_to: now
                group_by:
                  func: max
                  duration: 3h
                float_precision: 1
              - entity: sensor.mains_water_peak_flow_7d
                name: Peak 7d
                color: '#F44336'
                stroke_width: 1
                opacity: 0.5
                fill_raw: last
                extend_to: now
                group_by:
                  func: max
                  duration: 3h
                float_precision: 1
              - entity: sensor.mains_water_min_flow_24h
                name: Min 24h
                color: '#4CAF50'
                stroke_width: 2
                fill_raw: last
                extend_to: now
                group_by:
                  func: min
                  duration: 3h
                float_precision: 2
            apex_config:
              chart:
                height: 220
              stroke:
                curve: smooth
              legend:
                show: true
                position: top
                fontSize: 10px
                labels:
                  colors: '#aaa'
              yaxis:
                min: 0
                show: true
                labels:
                  style:
                    colors: '#888'
                    fontSize: 10px
                  formatter: EVAL:function(val) { return val.toFixed(1) + ' L/m' }
                axisBorder:
                  show: false
                axisTicks:
                  show: false
              xaxis:
                labels:
                  style:
                    colors: '#888'
                    fontSize: 10px
                  datetimeFormatter:
                    day: ddd
              grid:
                show: true
                borderColor: '#ffffff10'
                strokeDashArray: 3
                yaxis:
                  lines:
                    show: true
                xaxis:
                  lines:
                    show: false
              tooltip:
                enabled: true
                theme: dark
                'y':
                  formatter: EVAL:function(val) { return val.toFixed(2) + ' L/m' }

Thx a lot @alexdelprete for the great work !

As soon as I have time, I’ll create a custom integration that provides everything that is currently in the package.

This looks interesting. It’s been about a month since anyone has mentioned anything on this and wondering if it’s still recommended? The main thing I need this for is if there’s a continuous flow of water, it shuts off my Z-wave water valve…
I do recommend it.