I tracked channel utilization with ZHA to find the best Zigbee channel

I wanted to find the best possible channel for my Zigbee network, so I did some research and measured the channel utilisation in ZHA ten times (if you want to do this yourself, the instructions are here). I took the measurements at random over the course of two days. Sometimes there are several hours in between, sometimes about an hour, but never less than 45 minutes, I think.

Here is the raw data. On the left is the channel number, then the average usage, then the sum of all the readings. The top 3 channels (with the lowest utilisation) are marked in green:

grafik

I then created this graph from the summed values. Each layer represents a single measurement:

This graph shows the average utilisation from all measurements:

As you can see, there is a “valley” from channel 19 to 24. This was to be expected, as my wifi is currently set to channel 1, which explains the high usage of the lower channels. What I don’t understand is the high usage of the higher channels. I initially chose channel 25 because it was as far away from my wifi channels as possible, but now I know that this was not optimal. I don’t understand why, but that’s the way it is. Based on this evaluation, I will now change my network to channel 22 because, as you can see, it has the lowest utilisation of all the channels.

What I also find interesting here: Some channels apparently have huge jumps in utilisation, namely channels 19, 20, 21, 23. Utilisation here is usually below 10, but sometimes jumps to 40 or more. Channel 18 is constantly alternating between high and low values. This means that if you only take one measurement, you may come to the wrong conclusion. Only after taking several measurements will you have a better understanding of which channels seem to have little utilisation.

I will see what this change actually does and report back here with a conclusion.

1 Like

Well impressed with your work here ! Is it possible for you to fill in some of the details of how you did what you did etc. I think there will be more than a few of us who would like to run the same sort of tests. Thanks.

My networks show heavy activity on Channel 6. That’s where my DirecTV wireless receivers sit. I think the installer set that because he saw it was pretty quiet there. I just keep my zigbee on 15 because a) that’s the default :grinning: and b) I haven’t had any issues (I don’t have close neighbors).

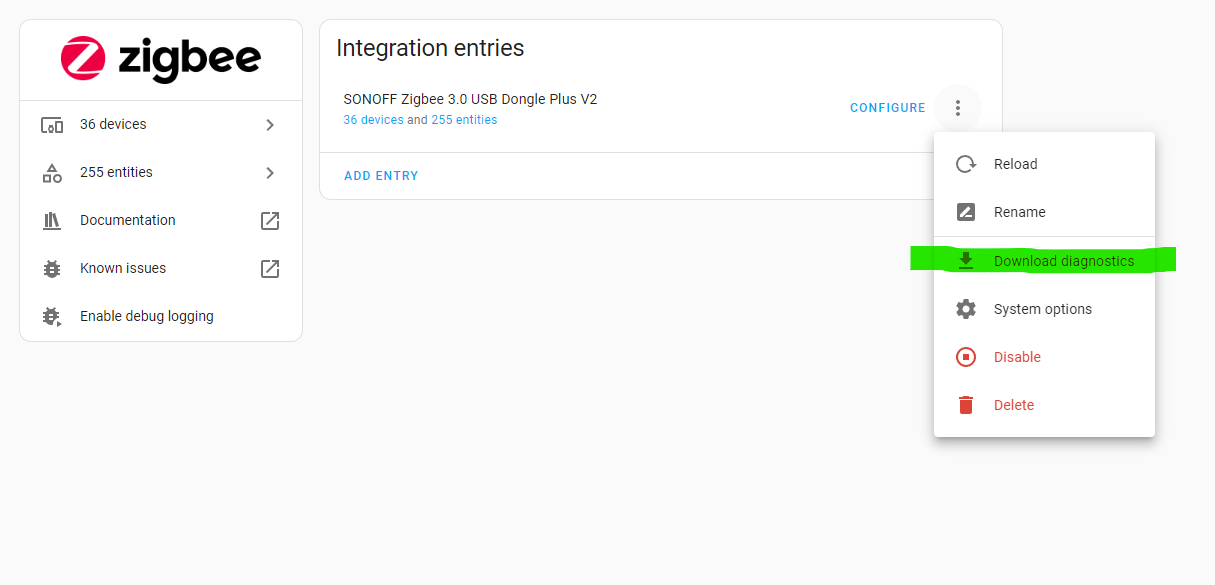
Sure, it’s pretty easy. I just downloaded the diagnostic file from the ZHA integration, which you can do here:

This will initiate the download of a file that you can edit in your default editor. Scroll down until you see “energy_scan” at the end:

These are the values for all channels. I just did this 10 times and copied all the values into an Excel document, which you can use to create the graphs. Of course you don’t need them, the numbers themselves are enough to estimate which channel might work.

2 Likes

TL;DR … your neighbours are also using Wi-fi, and it looks like someone fairly close is using wi-fi channel 13.

Long answer…
Wi-fi and zigbee are broadcast on radio frequencies (RF), though at different radio frequencies from free-to-air commercial radio and television. Each wi-fi device is a miniature radio transmitter - though has shorter range because of lower transmit power. In fact, the frequencies used by Wi-fi and zigbee overlap

You can happily listen to radio and watch television because RF signals do not stop at the edge of your property :slight_smile: … and similarly your neighbour’s wi-fi signals don’t stop at the border of your property. A wi-fi Analyser app on your android phone can illustrate which networks are within range, and how strong their signals are


Note also that the signal strengths will alter as you move around your property.

Don’t be fooled because you don’t see your neighbours devices on your Network Neighbourhood - each device listens to all the messages that are broadcast, but is programmed to ignore any that aren’t tagged with your network name (SSID). You could happily share the same radio frequency with several neighbours and not notice, if the total amount of network traffic is light. But if a neighbour is streaming 4K video over wi-fi - that’s a lot of large blocks of data - you might find that your data transfers are struggling to get a look-in, and your wi-fi has “slowed down”.

And there is the problem. We can’t easily see how much each channel is actually used, and that usage can change from minute to minute.
The best we can do is to look at the data we can collect, as you have done - try to interpret as you have done - make whatever changes seem appropriate - and hope the environment doesn’t change too much !