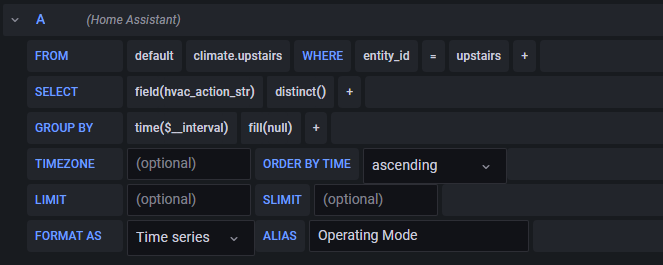
I was looking for ways to convert string states to numbers in grafana so I can graph them along with numbers to see when my A/C turns on and such. I found some good queries to use in my MariaDB database as it appears it can’t be done with the InfluxDB. I have MariaDB set up under my recorder config:
recorder:
  db_url: mysql+pymysql://user:[email protected]/home_assistant?charset=utf8
and influxdb:
influxdb:
  host: 192.168.x.x
  port: 8086
  username: !secret influxdb_user
  password: !secret influxdb_password
  ssl: true
  verify_ssl: false
I get NULLs in a lot of fields.
+----------+--------+------------------+-------------+------------+----------+----------------------------+----------------------------+---------+----------------------------+-----------------+--------------+---------------+------------+-------------------+
| state_id | domain | entity_id        | state       | attributes | event_id | last_changed               | last_updated               | created | context_id                 | context_user_id | old_state_id | attributes_id | origin_idx | context_parent_id |
+----------+--------+------------------+-------------+------------+----------+----------------------------+----------------------------+---------+----------------------------+-----------------+--------------+---------------+------------+-------------------+
| 51662335 | NULL   | climate.upstairs | heat_cool   | NULL       |     NULL | 2022-08-31 19:03:01.662043 | 2022-08-31 19:06:03.335277 | NULL    | 01GBTMQMP773RN9GSBPMBK60NE | NULL            |         NULL |        901639 |          0 | NULL              |
| 51662943 | NULL   | climate.upstairs | heat_cool   | NULL       |     NULL | NULL                       | 2022-08-31 21:03:27.962456 | NULL    | 01GBTVEM6TB47THKG261R08214 | NULL            |         NULL |       1249597 |          0 | NULL              |
| 51665619 | NULL   | climate.upstairs | heat_cool   | NULL       |     NULL | 2022-08-31 21:03:27.962456 | 2022-08-31 21:06:28.618606 | NULL    | 01GBTVM4MAZBARCQ6CF77Z1Q0D | NULL            |     51662943 |        765172 |          0 | NULL              |
I can’t pull the attribute information or even get the ‘created’ time. Is this a failure in a schema update or something? Is it because InfluxDB is configured? Can I fix this?

