Lovelace: mini graph card

Yes, most color formats should work since color is applied through css, exactly.

This would have been very cool but unfortunately no, at least not right now.
The line is rendered as a single SVG path, making it impossible to have different colors for different sections of the line.

In order to make this work we would need to rework the way we compute and render the graph. Possibly by splitting and rendering the line in smaller sections instead, and apply colors to the individual sections based on their value.
This would require a fair bit of additional which would make computing and rendering the graph a bit more demanding for the browser.

Might look into this more in the future. It’s a really cool idea, and by applying gradients to the individual line sections we could have them blend together which would look really great!

1 Like

Thanks for the answer, unfortunately I want to see the future temperature forecast, not the past. If you use the standard weather card and click for more details, you can get the next couple days of hourly forecast data, but I have no idea how to get this to graph.

please do, it would really make the sensor worth while for insight into behavior, and not just for the actual moment.
if you need a tester, please chime back in!

Okay, as I said, it’s not possible since the graph is computed from the sensors history data.

Yeah that’s kind of what I figured (that it’s not possible), but it’s a bit annoying knowing the data is there and can’t be graphed. Viewing it in tabular form is far less effective at conveying the data. Thanks for confirming my suspicion though.

Yup, it’s possible to graph it though, just not with the implementation of this card.

You could potentially modify the code of this card though and make it work, if you are into javascript.
Could be a cool card :slightly_smiling_face:

Just wondering if you are planning to have multiple lines (entities) per graph please? No worries if that’s beyond the scope of this card

Definitely, I want to implement this, and hopefully sooner than later.
It should work pretty well as long as the entities are within similar value range.

1 Like

I have this card:

  - type: custom:card-modder
    card:
      type: "custom:mini-graph-card"
      entity: sensor.dark_sky_wind_speed
      line_color: '#FFFFFF'
      line_width: 5
      hours_to_show: 168
    style:                 
      width: 90px
      height: 90px
      font-size: 8px
      --primary-text-color: var(--primary-text-color)
      --secondary-text-color: var(--secondary-text-color)
      --paper-item-icon-color: var(--primary-text-color) #small variation icons
      background-repeat: no-repeat
      background-size: 100% 600px
      border-radius: 20px
      border: solid 1px rgba(100,100,100,0.3)
      box-shadow: 3px 3px rgba(0,0,0,0.4)`Preformatted text`

50

How to change the font size in the name of entity?

EDIT: I updated to the last version of the card, changed the card code to:

  - type: custom:card-modder
    card:
      type: "custom:mini-graph-card"
      entity: sensor.dark_sky_apparent_temperature
      name: Temperatura Percepita
      line_color: '#FFFFFF'
      line_width: 5
      hours_to_show: 168
      hide:
        - icon
    style:                 
      background-image: url("/local/lovelace/images/weather-background-[[ sun.sun.state ]].png")
      --primary-text-color: var(--primary-text-color)
      --secondary-text-color: var(--secondary-text-color)
      --paper-item-icon-color: var(--primary-text-color) #small variation icons
      background-repeat: no-repeat
      background-color: rgba(50,50,50,0.3)
      background-size: 100% 600px
      border-radius: 20px
      border: solid 1px rgba(100,100,100,0.3)
      box-shadow: 3px 3px rgba(0,0,0,0.4)`Preformatted text`

But now i’m getting this:

52

What happened? How to solve?

Not possible, unless you edit the source.
https://github.com/kalkih/mini-graph-card/blob/master/mini-graph-card.js#L260

graphData isn’t references anywhere in the later versions of the code, grab the latest bundle version and change the ?v= at the end of the resource reference in ui-lovelace.yaml if you didn’t already.
If that doesn’t solve it, clear cache or/and restart HA.

About the size of the font will be possible in future? And which value to use in the source to lower the size?
I got the latest, which value to put in the resources to make the .js recognized by custom updater? Actually it is not recognized like, for example, mini-media-player card…

Most likely no.
A lower value than the current, lower value equals smaller size.

Follow the instructions and you should be good.

# ui-lovelace.yaml
resources:
  - url: /local/mini-graph-card-bundle.js?v=0.1.0
    type: module
# configuration.yaml
custom_updater:
  card_urls:
    - https://raw.githubusercontent.com/kalkih/mini-graph-card/master/tracker.json
    ...

@kalkih I’ve just updated to latest of your card (it has been awhile) and I am encountering an error

the error looks to be trying to load the card from within custom_ui folder when it has been specified it sits in another location?

Whoops just looked at the error more closely lol looks to be with the card_modder ignore.

1 Like

Hello everyone, I’m here to share a sneak peak of some upcoming features and design (WIP).

  • Support for multiple entities
  • New design (old is still available)
  • Animations
  • min/max information
  • Additional options to rearrange ui elements
  • Support for multiple value thresholds for dynamically changing the graph color

13 Likes

Love the look of that second graph. I can see a few uses for it already in my UI.

1 Like

beatiful!
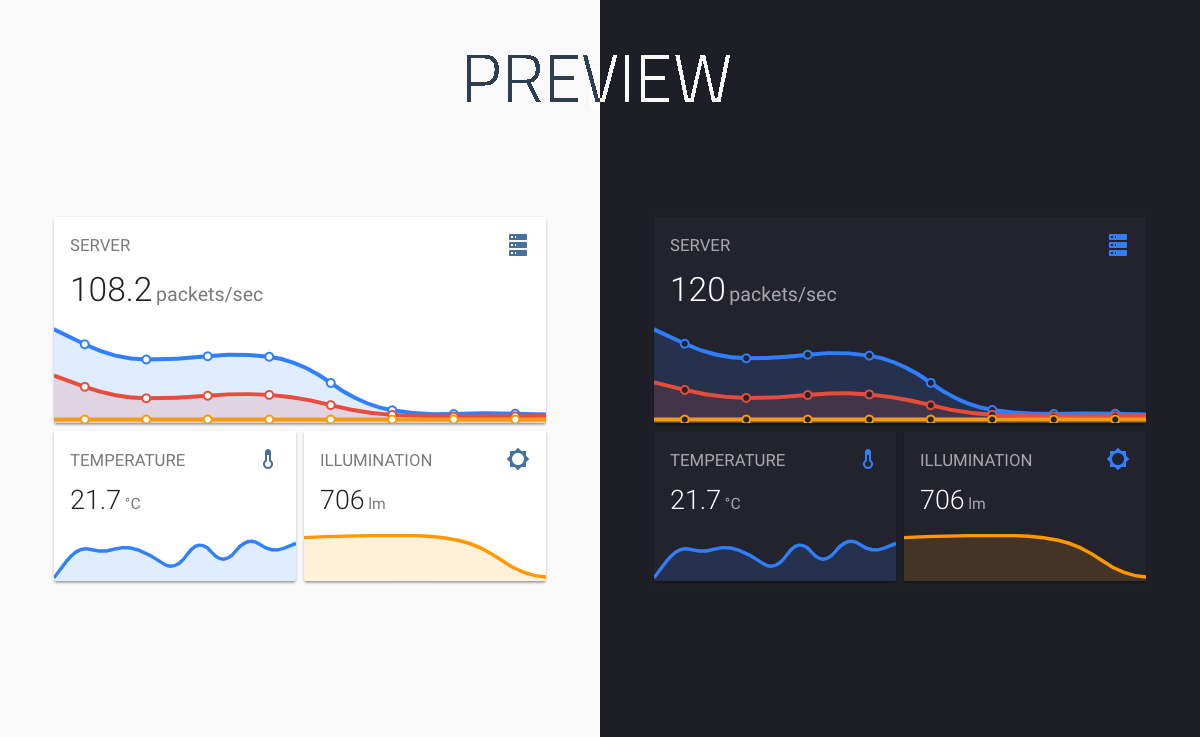
hope these graph color changes work out as we discussed before. This makes for a very nice history-graph.
thanks in advance for the good work!

1 Like

Thanks Karl,

Can’t wait to see how these look with my weather station project. Thanks for your work in implementing min & max temps. Once you get inspired your turn around is so quick thanks.

1 Like

Not yet, but I’ll see what I can do about it :wink:

Thanks! Yes, It’s all about getting inspired and you managed to get me just that :laughing:

I have a lot more for you when you get done with these additions lol :wink:

I have ideas around threshold graphs and “green zones” for the plant sensors I will pm you a screen of what I have.

NEW RELEASE v0.2.0

Including a redesign, support for multiple entities, optional animations & much more.

A few breaking changes had to me made (see changelog) in order to make some of the new features possible, checkout the updated README for up to date instructions and examples.

Big thanks to @jimpower for inspiration & brainstorming, and thanks to @iantrich for adding the group option.

@Mariusthvdb Multi-colored graph lines based on state did not make it into this release, unfortunately.

EDIT: Forgot to say it but if you’re not a fan of the new design, you can still have the old look by setting some options, see this example for some pointers.

Changelog

  • UI redesign

  • Added: support for multiple entities (BETA) #28

  • Added: support for multiple line_color entries

  • Added: graph data points with information on hover, see points option under the show option

  • Added: animate option to have the graph animated on initial load

  • Added: points_per_hour option to specify amount of data points that should be rendered for each hour (basically the graph detail/accuracy).

  • Added: support for multiple color thresholds with new line_color_above & line_color_below options

  • Added: allocated space for the graph -> less jerky movements when loading in

  • Added: graph legend, visible if multiple entities is present

  • Added: align_header, align_icon & align_state options #27

  • Added: show option, to manage visible/hidden UI elements

  • Added: entities option

  • Added: group option to remove paddings/box-shadow #26 (@iantrich)

  • Fixed: bug were history data would be fetched when graph was hidden

  • Fixed: decimals option not being applied to labels #19

  • Fixed: Y-scale based on absolute extrema causing inconsistent results, now based on moving average same as the rest of the graph.

  • Deprecated: entity option, use new entities, accepts string or list (deprecated)

  • Removed: detail option, use new points_per_hour option (Breaking change)

  • Removed: hide options, use new show option (Breaking change)

  • Removed: labels option, use labels in new show option (Breaking change)

  • Removed: line_value_above, line_color_above, line_value_below & line_color_below options (Breaking change)

12 Likes