Lovelace: mini graph card

It works on my setup (0.11.0):

Depends on what values does you attribute have.
If you have numericals - state_map not need.
Otherwise - surely yes.

Seems you are treating state_map in a wrong way.
It associates a real value with a displayed string.
But - how do you imagine a graph with non-numericals?
The only way to show a graph is to associate non-numericals with numericals:

  • ugly=0
  • unpleasant=1
  • good=2
  • very good=3

    This may be done by some template sensor.

Most of the cases for state_map are like:

      state_map:
        - value: 'off'  #### which is "0" - so this is a numerical
          label: Bad ##(or Day, or Switched OFF)
        - value: 'on'  #### which is "1"
          label: Good ##(or Night, or Switched ON)

@Ildar_Gabdullin what you wrote is not really ‘true’.

Both theoretically and practically you can define graphs without numerical value. State_map from one side could be used for such situations, when the original textual value is not your preferred one. Of course the numerical usage is the most common and basic, but it works without any problem with strings.

All different states are really different ‘states’, call them ‘levels’ in the graph. The order of them is what you define in the config from top to bottom as less to more.

For example:

Just try it, will work, I use it, and the original manual also mention such use case.

Also check this ‘official example’: GitHub - kalkih/mini-graph-card: Minimalistic graph card for Home Assistant Lovelace UI

And because of it I think textual attribute values could follow the same working method (as states already do)

Try this case w/o interpolation.

These are binary sensors.

These are binary sensors.

It is absolutely true and maybe this could be the differences between the situations. But #1 anyway the card itself seems parse its values as string and this is why we can get usable results from them. But #2 seems you light the reason of the problem as it is really true, if the sensor has textual values I really have to use state_map to extract its data. In this case this is really not different in state or attribute examination. Both works in the same way, there is no need to consolidate them.

Thanks for the direction!

But as the summarizaton we can simply use the card for textual values if we already know the sensor’s value-set (which type is in this case indifferent… we can use strings, number, anything). The result is perfect with textual values also, just as the ‘topic’ says we have to use state_maps to define the discrete levels.

Honestly, that was a really new thing for me.
I tested with state_map some time ago - then stopped using it since I needed state_map only for a secondary graph and it flooded the browser with errors like “value not found in state_map”.

I tested with this code:

type: vertical-stack
cards:
  - type: entities
    entities:
      - entity: input_select.persons_list
  - type: custom:mini-graph-card
    entities:
      - entity: input_select.persons_list
    hours_to_show: 0.183333
    points_per_hour: 480
    line_width: 1
    smoothing: false
    aggregate_func: last
    state_map:
      - value: Ильдар
        label: ildar
      - value: ...
        label: ...
      - value: ...
        label: ...
      - value: ...
        label: ...
      - value: ...
        label: ...
      - value: ...
        label: ...
      - value: ...
        label: ...
    color_thresholds_transition: hard
    color_thresholds:
      - value: Ильдар
        color: red
      - value: ...
        color: orange
      - value: ...
        color: yellow
      - value: ...
        color: green
      - value: ...
        color: cyan
      - value: ...
        color: blue
      - value: ...
        color: violet

image
Color is always violet. Not sure that thresholds work with non-numericals…

Yes, the only problem is the constant color (what you mentioned, and I wrote it also before). From any other aspect the solution works fine. I already reported the color problem at Github. Of course not as a hard bug report just a question as a possibility…


Anyway here is my comment on your help:

Thanks. I’ve been looking for this, but unfortunately I seem to be unable to reproduce your results. All I did was change my entities but things still don’t seem to line up properly.

image

Check this post about vertical misalignment.
Nothing we can do with that.

P.S. Try not using AM/PM time format. It will help - a little (see example on the post mentioned above).

Hi everyone!
Can someone help me? I need to know if theres a way to change de offset position (top, bot) on css of the card. Mine looks bugged because other templates that i use. As you can see, the min and max values they get cut and dont show:
image
image

My code:

          - type: custom:mini-graph-card
            entities:
              - entity: sensor.mikrotik_ether1_rx
                name: test
            name: Download Link 1 
            line_color: var(--state-icon-active-color)
            hours_to_show: 1
            points_per_hour: 10
            min_bound_range: 1
            show:
              icon: false
              average: false
              extrema: true
              state: false


          - type: custom:mini-graph-card
            entities:
              - sensor.mikrotik_ether1_tx
              - sensor.mikrotik_ether1_rx
            name: Upload Link 1 
            line_color: var(--state-icon-active-color)
            hours_to_show: 1
            points_per_hour: 10
            show:
              legend: false

You can probably do it with card-mod. Head over to one of the huge card-mod threads for help.

I thought about it at first. however, even putting the css there, and it appearing in the page code, has no effect on the styles.
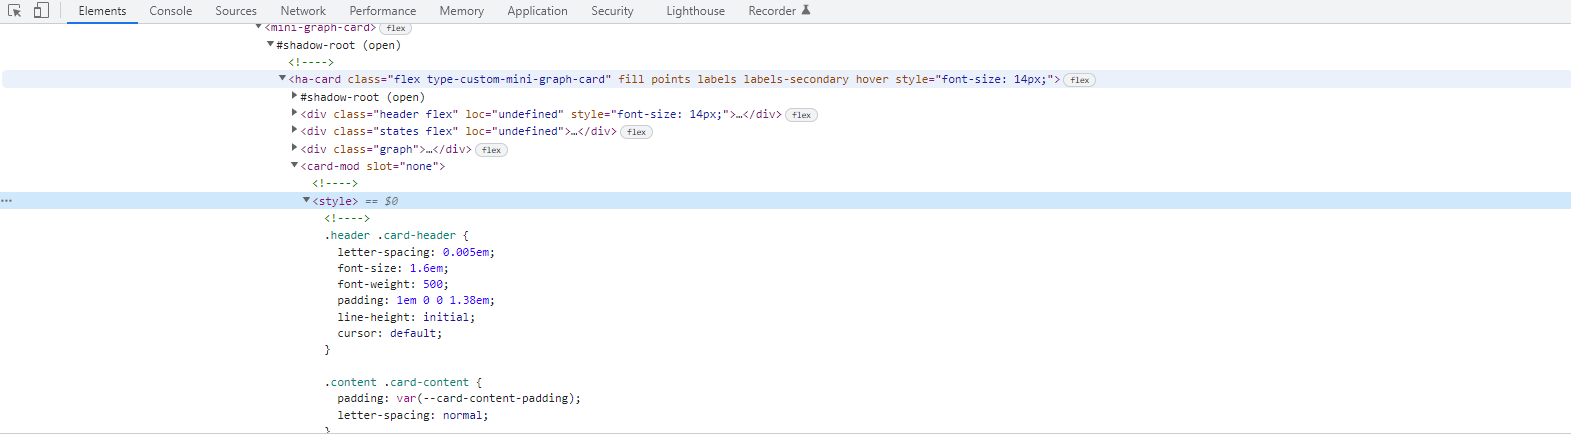
I dont know, but the style should be first on the code, right? the card_mod is putting after the code of the card itself:

The code with the card_mod custom:

          - type: custom:mini-graph-card
            entities:
              - sensor.mikrotik_ether1_tx
              - sensor.mikrotik_ether1_rx
            name: Upload Link 1 
            line_color: var(--state-icon-active-color)
            hours_to_show: 1
            points_per_hour: 10
            show:
              legend: false
            card_mod:
                  style: |
                    .graph__labels {
                      top: -30px;
                      }

This doesn’t have anything to do with the mini graph card directly.

Seek help here:
:small_blue_diamond: Card-mod - Super-charge your themes! - Share your Projects! / Themes - Home Assistant Community (home-assistant.io)
:small_blue_diamond: Card-mod - Add css styles to any lovelace card - Share your Projects! / Lovelace & Frontend - Home Assistant Community (home-assistant.io)

Anyway, try:

            card_mod:
                  style: |
                    .graph__labels {
                      top: -30px !important;
                      }
1 Like

Thanks man, the !important flag solve the problem. Thank you!

1 Like

Anyone advise how I could move the humidity text just underneath the temperature? I have seven MGC in a row and there is not enough space to have the temp and humidity side by side because of the screen ratio of my main tablet.

image

type: custom:mini-graph-card
entities:
  - sensor.temperature_xiaomi_rumpus
show:
  labels: false
style: |
  ha-card .states.flex::after {
    color: orange;
    content: "Humidity: {{states('sensor.humidity_xiaomi_rumpus')}}%";
    white-space: pre;
    background-color: rgba(50,50,50,0.4);
    padding: 15px 15px 15px 15px;
    border-radius: 5px;
  }

I’d like to do something like this:

image

Scroll two posts up and check those links.

  - type: custom:mini-graph-card
    entities:
      - sensor.cleargrass_1_temperature
    show:
      labels: true
    style: |
      .states.flex {
        flex-direction: column;
      }
      .states.flex::after {
        color: blue;
        content: "Humidity: {{states('sensor.cleargrass_1_humidity')}} %";
      }

изображение

Examples here (scroll down for mini-graph-card):
post

2 Likes

Gee Whiz! That is freak’n awesome, thank you. Would have never figured that out on my own. :+1:

is there a way to filter out entities? i have some probes that are used now and then and want to filter them out when they are unavailable or unplugged so i dont have to update the config

mini-graph-card + auto-entities

Is there a way to add binary switches with analogue values? I want to show when the switch to my air purifier turns on, and then have the air gas reading on the same graph. Is it possible?