@karwosts and @gris74 I have revisited this now I have finally had a day with rain, that coincided with some available time to look at it properly.
Comments throughout the YAML.
These graphs use the Netatmo Rainfall sensors directly
- Hourly Rolling Cumulative Rainfall
state_class: total
unit_of_measurement: mm
attribution: Data provided by Netatmo
device_class: precipitation
friendly_name: Netatmo Rain Precipitation last hour
- Daily Cumulative Rainfall (Resets Midnight)
state_class: total_increasing
unit_of_measurement: mm
attribution: Data provided by Netatmo
device_class: precipitation
friendly_name: Netatmo Rain Precipitation today
### What’s happening under the hood
* Daily cumulative (…rain_today)
Increases when it’s raining and resets at midnight. Good for today and as a base for derived totals.
* statistics: acts as a first bucketing stage
type: state, period: day, align: end collapses raw history to one sample per calendar day (the end-of-day cumulative). This prevents over-counting when you later sum across longer windows.
* group_by: is the second bucketing stage
* duration: 1h, func: diff → turn cumulative into hourly bars.
* duration: 1d, func: max → daily totals (end-of-day cumulative).
* duration: 30d, func: sum (on day-level stats) → rolling 30-day total.
* duration: 1month, func: sum (on day-level stats) → monthly totals.
* duration: 12month, func: sum (on day-level stats) → rolling 12-month total.
* span: offset: '+1h' HOURLY RAINFALL
Shifts the window start forward one hour so the first hour bucket does not pick up yesterdays total, prior midnight. Without the offset, ApexCharts will pick up the bucket start, previous to midnight and produce a negative figure.
* span.offset: '+1d' DAILY RAINFALL
Shifts the window end forward one day so the latest day/month bucket appears even before it completely closes. Without the offset, ApexCharts often hides the last (still-forming) bar until the bucket end.
What’s happening under the hood
-
Daily cumulative (
…rain_today)
Increases while it’s raining and resets at midnight. Great base for derived totals. -
Bucketing stages
statistics:first bucket —type: state, period: day, align: endcollapses raw history to one end-of-day sample per calendar day. This prevents over-counting when you sum over longer windows.group_by:second bucket — performs the final aggregation you want to plot/show.
-
Hourly bars (correct + live)
Use 5-minute deltas of the daily cumulative (statistics: type: change, period: 5minute) → clamp negatives → sum to 1h. This updates mid-hour and survives sensor dips/resets. -
Daily/rolling/monthly
Keep using the day EOD approach for accuracy and speed:duration: 1d, func: max→ daily totals (end-of-day cumulative)duration: 30d, func: sum(on day EOD) → rolling 30-day totalduration: 1month, func: sum(on day EOD) → monthly totalsduration: 12month, func: sum(on day EOD) → rolling 12-month total
NOTE: 5/10/30min deltas can be used here to increase update interval but will increase processing overhead
-
Offsets
- Hourly: not needed with the 5-minute method (offsets only move the viewport).
- Daily/Monthly:
span.offset: '+1d'is useful to show the still-forming today/this month bar.
It would be great if someone using monthly or annual, statistic sensor or utility meter can confirm if the below graphs are correct.
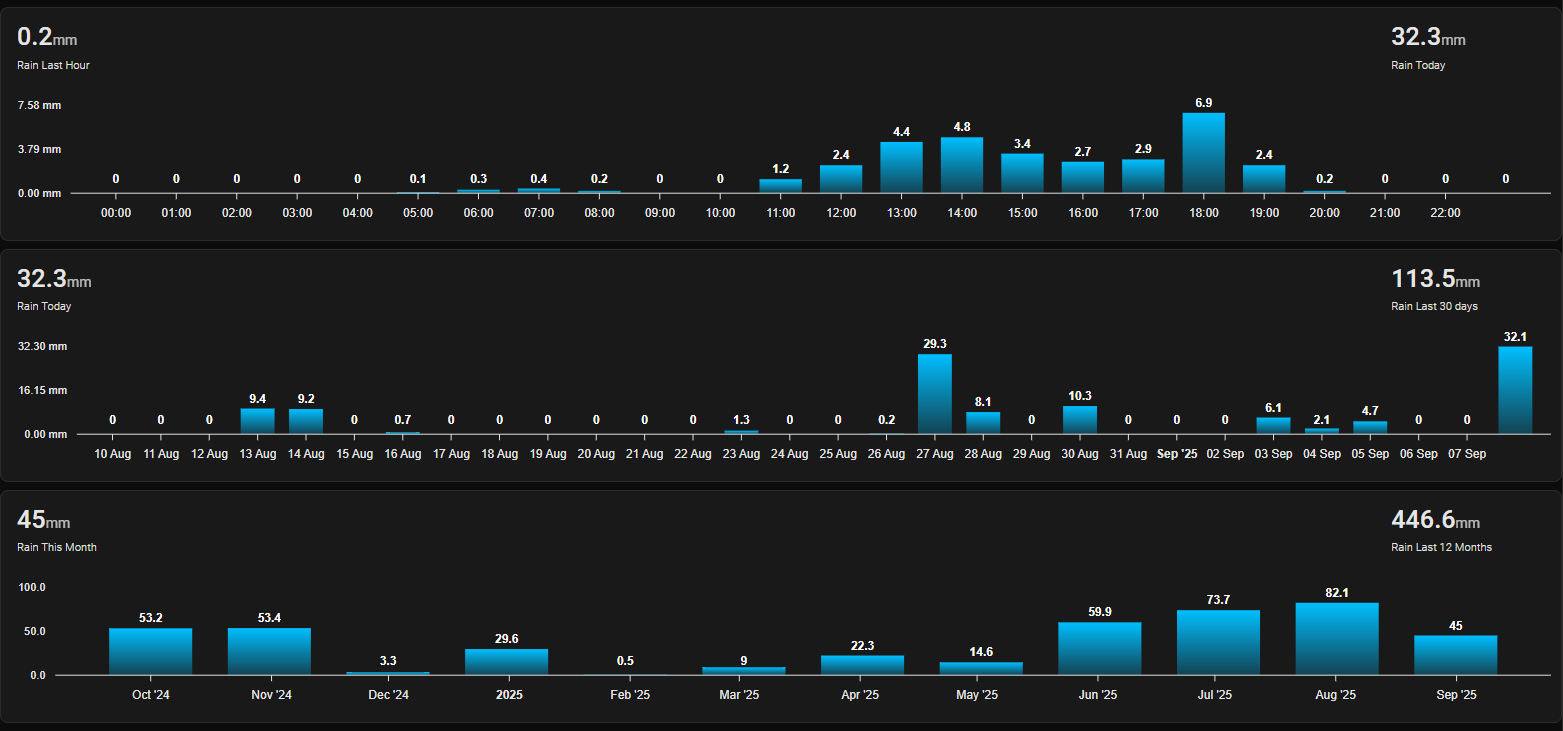
DAILY RAINFALL
- Hourly Bars (from daily cumulative)- Hourly Bars (from 5-minute deltas of daily cumulative)
- Rain Last Hour (from rolling hourly cumulative)(raw sensor)
-span:offset: '+1h'to prevent a negative number at midnight- Rain Today (from daily cumulative) (5-minute deltas → 1d sum)
Header chips show:
- Rain Last Hour (Netatmo rolling 60-min sum)
- Rain Today (daily cumulative)
- The bars are computed from the DAILY cumulative using diff per hour.- The bars are computed from 5-minute deltas (gives live updates).

type: custom:apexcharts-card
header:
  title: >
    Rain — Hourly Bars (from daily cumulative) - Rain Last Hour
    (rolling 60-min) - Rain Today (sum of 5-min deltas)
  show: true
  show_states: true
graph_span: 24h
span:
  end: day
yaxis:
  - min: 0
    decimals: 1
    apex_config:
      labels:
        formatter: |
          EVAL: (v) => `${(v ?? 0).toFixed(2)} mm`
apex_config:
  fill:
    type: gradient
    gradient:
      type: vertical
      shadeIntensity: 0
      opacityFrom: 1
      opacityTo: 0.5
      stops: [0, 100]
  chart:
    height: 150px
  grid:
    show: false
    borderColor: darkslateblue
    strokeDashArray: 2
  dataLabels:
    background:
      borderWidth: 0
      opacity: 0
      foreColor: white
    offsetY: -10
  plotOptions:
    bar:
      borderRadius: 0
      dataLabels:
        position: top
series:
  - entity: sensor.netatmo_devonport_tas_indoor_rain_rain_last_hour
    name: Rain Last Hour
    type: line
    show:
      in_chart: false
      in_header: true

  - entity: sensor.netatmo_devonport_tas_indoor_rain_rain_today
    name: Hourly Rain Bars
    color: deepskyblue
    type: column
    statistics:
      type: change
      period: 5minute
      align: end
    transform: "return x < 0 ? 0 : x;"
    group_by:
      duration: 1h
      func: sum
      start_with_last: true
    show:
      in_chart: true
      datalabels: true
      in_header: false

  - entity: sensor.netatmo_devonport_tas_indoor_rain_rain_today
    name: Rain Today
    type: line
    statistics:
      type: change
      period: 5minute
      align: end
    transform: "return x < 0 ? 0 : x;"
    group_by:
      duration: 1d
      func: sum
      start_with_last: true
    show:
      in_chart: false
      in_header: true
      name_in_header: true
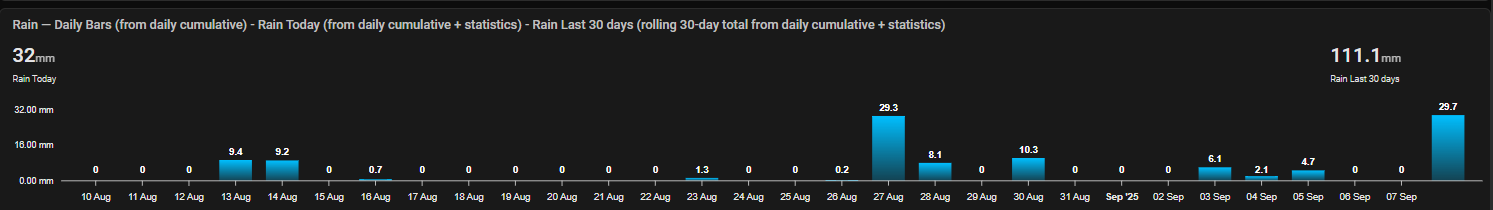
ROLLING 30 DAY RAINFALL
- Daily Bars (from daily cumulative)
- Rain Today (from daily cumulative + statistics day bucket)
- Rain Last 30 days (rolling 30-day total from daily cumulative + statistics day bucket)
KEY IDEAS:
-
statistics: period: day, align: end → FIRST reduces the raw history to ONE value per day: the end-of-day cumulative. (This is the “second bucket” stage that avoids over-counting intra-day samples.)
-
group_by on top of that day-level series then does the per-day bar and the rolling 30-day sum accurately.
OFFSET EXPLANATION:
- span.offset: ‘+1d’ nudges the window end forward one day so the latest day’s bar (which completes at 23:59:59) is included and renders correctly even before midnight.
          - type: custom:apexcharts-card
            header:
              title: >-
                Rain — Daily Bars (from daily cumulative) - Rain Today (from
                daily cumulative + statistics)  - Rain Last 30 days (rolling
                30-day total from daily cumulative + statistics)
              show: true
              show_states: true
            graph_span: 30d                            # <- x-axis shows last 30 days
            span:
              end: day
              offset: '+1d'                            # <- include the "current day" bar before the day fully closes
            yaxis:
              - min: 0
                decimals: 1
                apex_config:
                  labels:
                    formatter: |
                      EVAL: (v) => `${(v ?? 0).toFixed(2)} mm`
            apex_config:
              fill:
                type: gradient
                gradient:
                  type: vertical
                  shadeIntensity: 0
                  opacityFrom: 1
                  opacityTo: 0.5
                  stops:
                    - 0
                    - 100
              chart:
                height: 150px
              grid:
                show: false
                borderColor: darkslateblue
                strokeDashArray: 2
              dataLabels:
                background:
                  borderWidth: 0
                  opacity: 0
                  foreColor: white
                offsetY: -10
              plotOptions:
                bar:
                  borderRadius: 0
                  dataLabels:
                    position: top
              tooltip:
                x:
                  format: 'dd MMM yyyy'
            series:
              # HEADER STATE: Today's cumulative (live).
              - entity: sensor.netatmo_rain_today
                name: Rain Today
                type: line
                show:
                  in_chart: false
                  in_header: true
                  name_in_header: true

              # BARS: Daily totals (exact) from the daily cumulative.
              # STAGE 1 (statistics): collapse raw history to ONE value per day,
              #   using end-of-day cumulative (type: state, period: day, align: end).
              # STAGE 2 (group_by): pick the day's MAX (defensive; aligns with EOD).
              - entity: sensor.netatmo_rain_today
                name: Daily total
                color: deepskyblue
                type: column
                group_by:
                  duration: 1d                         # <- 1 bar per day
                  func: last                            # <- end-of-day cumulative
                  start_with_last: true
                  fill: zero
                statistics:
                  type: state                          # <- take the entity's state (not avg/min/max inside the day)
                  period: day                          # <- FIRST bucket to one sample per calendar day
                  align: end                           # <- choose the end-of-day value (true daily total)
                show:
                  in_chart: true
                  datalabels: true
                  in_header: false
                stroke_width: 0

              # HEADER STATE: Rolling 30-day total.
              # STAGE 1 (statistics day, align end): one value per day (EOD cumulative).
              # STAGE 2 (group_by 30d + sum): sum the last 30 *days* → true rolling 30-day rainfall.
              - entity: sensor.netatmo_rain_today
                name: Rain Last 30 days
                type: line
                group_by:
                  duration: 30d                        # <- rolling window size = 30 days
                  func: sum                            # <- sum those daily EOD values → 30-day total
                  start_with_last: true
                  fill: zero
                statistics:
                  type: state
                  period: day
                  align: end                           # <- ensure the day-level value is the EOD snapshot
                show:
                  in_chart: false
                  in_header: true
                  name_in_header: true
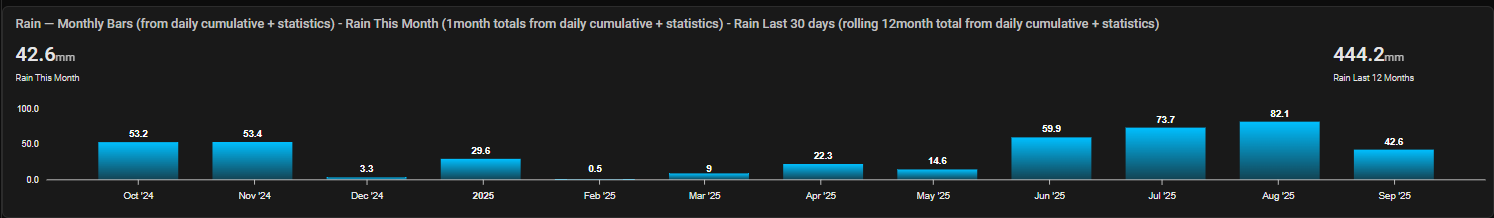
ROLLING 12 MONTH RAINFALL
- Rain — Monthly Bars (from daily cumulative + statistics)
- Rain This Month (1month totals from daily cumulative + statistics day bucket)
- Rain Last 12 Months (rolling 12month total from daily cumulative + statistics day bucket)
SAME “SECOND BUCKET” IDEA:
- statistics period: day, align: end → one EOD data point per day.
- THEN group_by over 1 month with func: sum → exact month totals.
OFFSET EXPLANATION:
- span.offset: ‘+1d’ lets the current month’s bar appear before midnight of the last day by nudging the end of the window forward.
          - type: custom:apexcharts-card
            header:
              title: >-
                Rain — Monthly Bars (from daily cumulative + statistics) - Rain
                This Month (1month totals from daily cumulative + statistics)  -
                Rain Last 12 Months (rolling 12month total from daily cumulative +
                statistics)
              show: true
              show_states: true
            graph_span: 12month                         # NOTE works in many setups; if your card requires it, use 12mo
            span:
              end: month                                # <- align buckets to calendar months
            apex_config:
              fill:
                type: gradient
                gradient:
                  type: vertical
                  shadeIntensity: 0
                  opacityFrom: 1
                  opacityTo: 0.5
                  stops: [0, 100]                       # <- array; avoids Apex error
              chart:
                height: 150px
              grid:
                show: false
                borderColor: darkslateblue
                strokeDashArray: 2
              dataLabels:
                background:
                  borderWidth: 0
                  opacity: 0
                  foreColor: white
                offsetY: -10
              plotOptions:
                bar:
                  borderRadius: 0
                  dataLabels:
                    position: top
              tooltip:
                x:
                  format: 'MMM yyyy'
            series:
              # MONTHLY BARS: exact month totals from the daily cumulative.
              # STAGE 1: statistics day/end → one EOD point per day.
              # STAGE 2: group_by month/sum → sum of those day points in that month.
              - entity: sensor.netatmo_rain_today
                name: Rain This Month
                color: deepskyblue
                type: column
                group_by:
                  func: sum                              # <- adds the daily EOD values inside each month
                  duration: 1month                       # NOTE: works in many setups; if needed, use 1mo
                  fill: zero
                statistics:
                  type: state
                  period: day
                  align: end                              # <- use end-of-day cumulative as the "daily total"
                show:
                  name_in_header: true
                  datalabels: true
                  in_chart: true
                  legend_value: false
                  extremas: false

              # HEADER STATE: rolling last 12 months (sum of month’s daily EOD values).
              # STAGE 1: statistics day/end → daily EOD points.
              # STAGE 2: group_by 12month/sum → rolling 12-month rainfall.
              - entity: sensor.netatmo_rain_today
                name: Rain Last 12 Months
                color: deepskyblue
                type: column
                group_by:
                  func: sum
                  duration: 12month                      # NOTE if your card requires, use 12mo
                  fill: zero
                statistics:
                  type: state
                  period: day
                  align: end
                show:
                  name_in_header: true                   # <- show the rolling 12-month total as a header state
                  datalabels: false
                  in_chart: false                        # <- chip only; hide from plot
                  legend_value: false
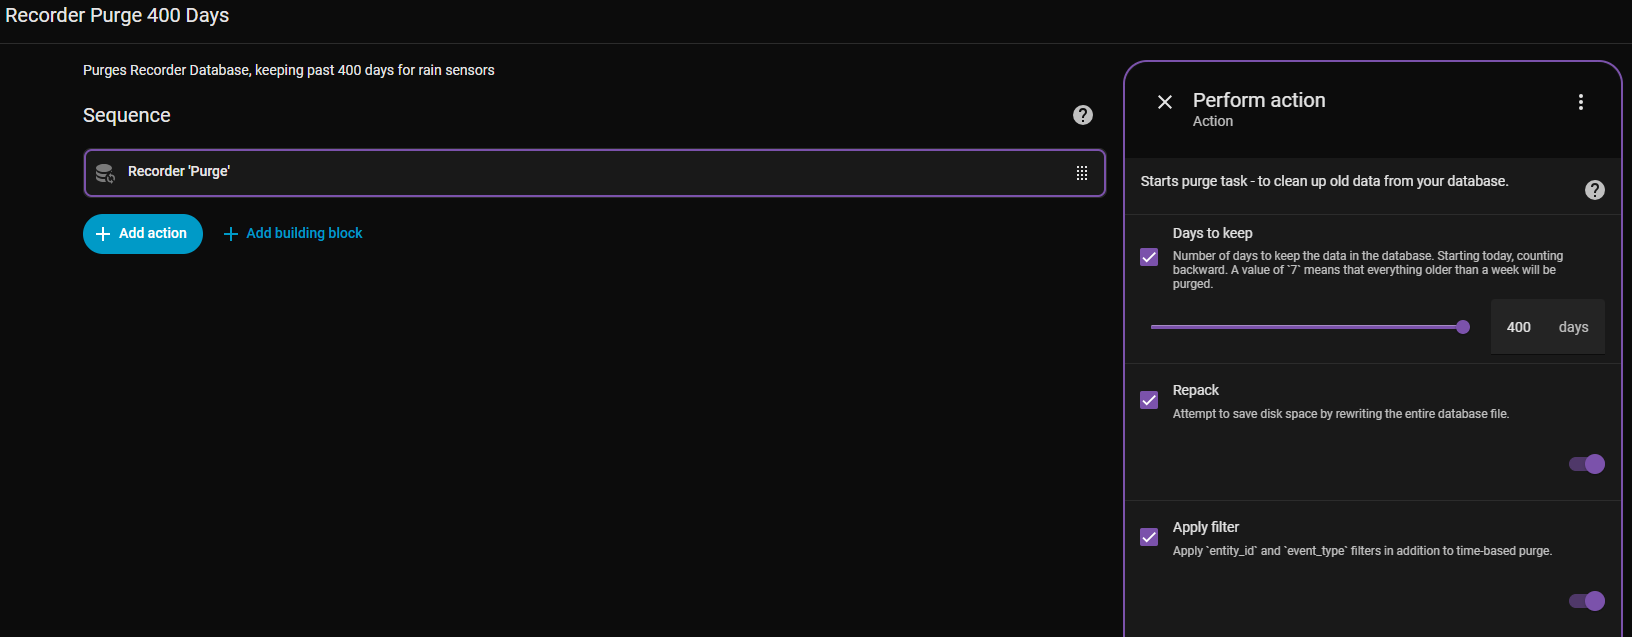
Make sure Recorder retention covers your windows (e.g., ≥ 400 days if you ever want a full 12-month rolling history without gaps).
Example Action Call that I call weekly, to ensure database stays at a reasonable size.
The filter is applied by:
- in
configuration.yamlrecorder:you can choose either ruleinclude:(add sensors you want in recorder database) or;exclude:(add sensors you don’t want in recorder database)
To avoid a huge database slowing your HA instance down make sure you only include the sensors you need to for 400 days.