In the underlying example rain precipitation data from a PostgreSQL/Timescale database should be graphical represented in Grafana. The rain precipitation data present are just climbing up. I am interested in the total precipitation data each hour of the day or each day of the year.
The discussion concerning this item will be continued here…
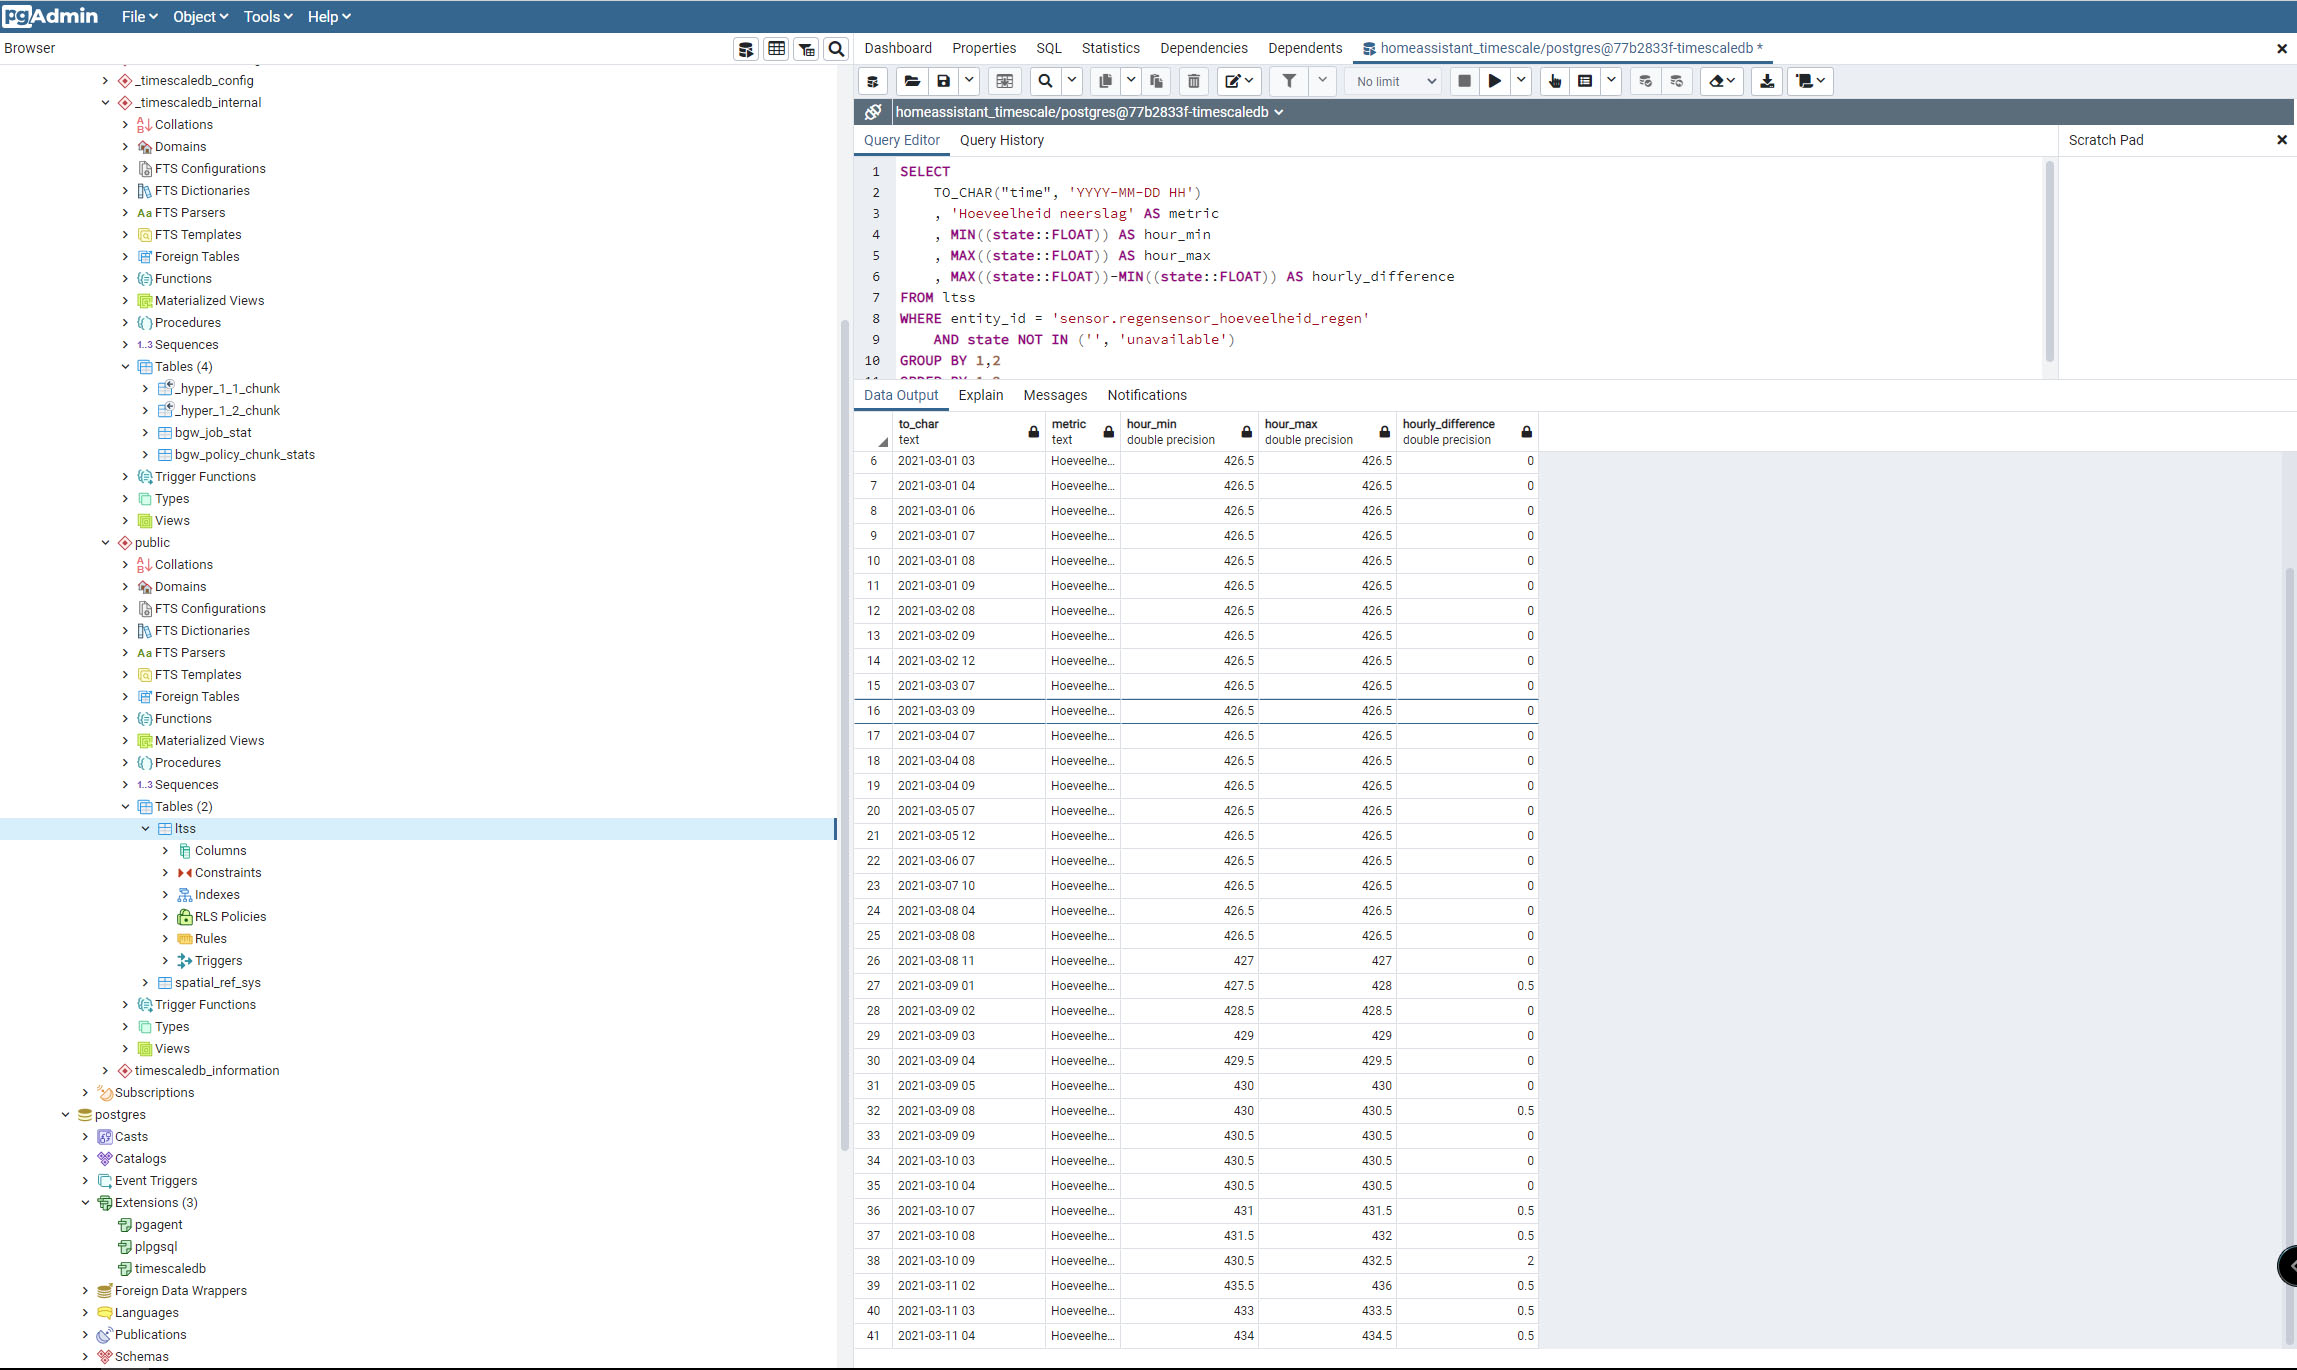
What does yout data look like, when you make this query with pgadmin:
SELECT
    TO_CHAR("time", 'YYYY-MM-DD HH')
    , 'Hoeveelheid neerslag' AS metric
    , MIN((state::FLOAT)) AS hour_min
    , MAX((state::FLOAT)) AS hour_max
    , MAX((state::FLOAT))-MIN((state::FLOAT)) AS hourly_difference
FROM ltss
WHERE entity_id = 'sensor.regensensor_hoeveelheid_regen'
    AND state NOT IN ('', 'unavailable')
GROUP BY 1,2
ORDER BY 1,2
When I compare the data from Query 2 with the actually found precipitation values I have the impression that the table is oke.
However in Query 1 a lot of time values are not there!
Thanks for creating a separate thread! I’ve taken the liberty to link to this thread from my opening post on the timescale thread, so we can collect this knowledge here, and my original thread stays available for troubleshooting and announcements.
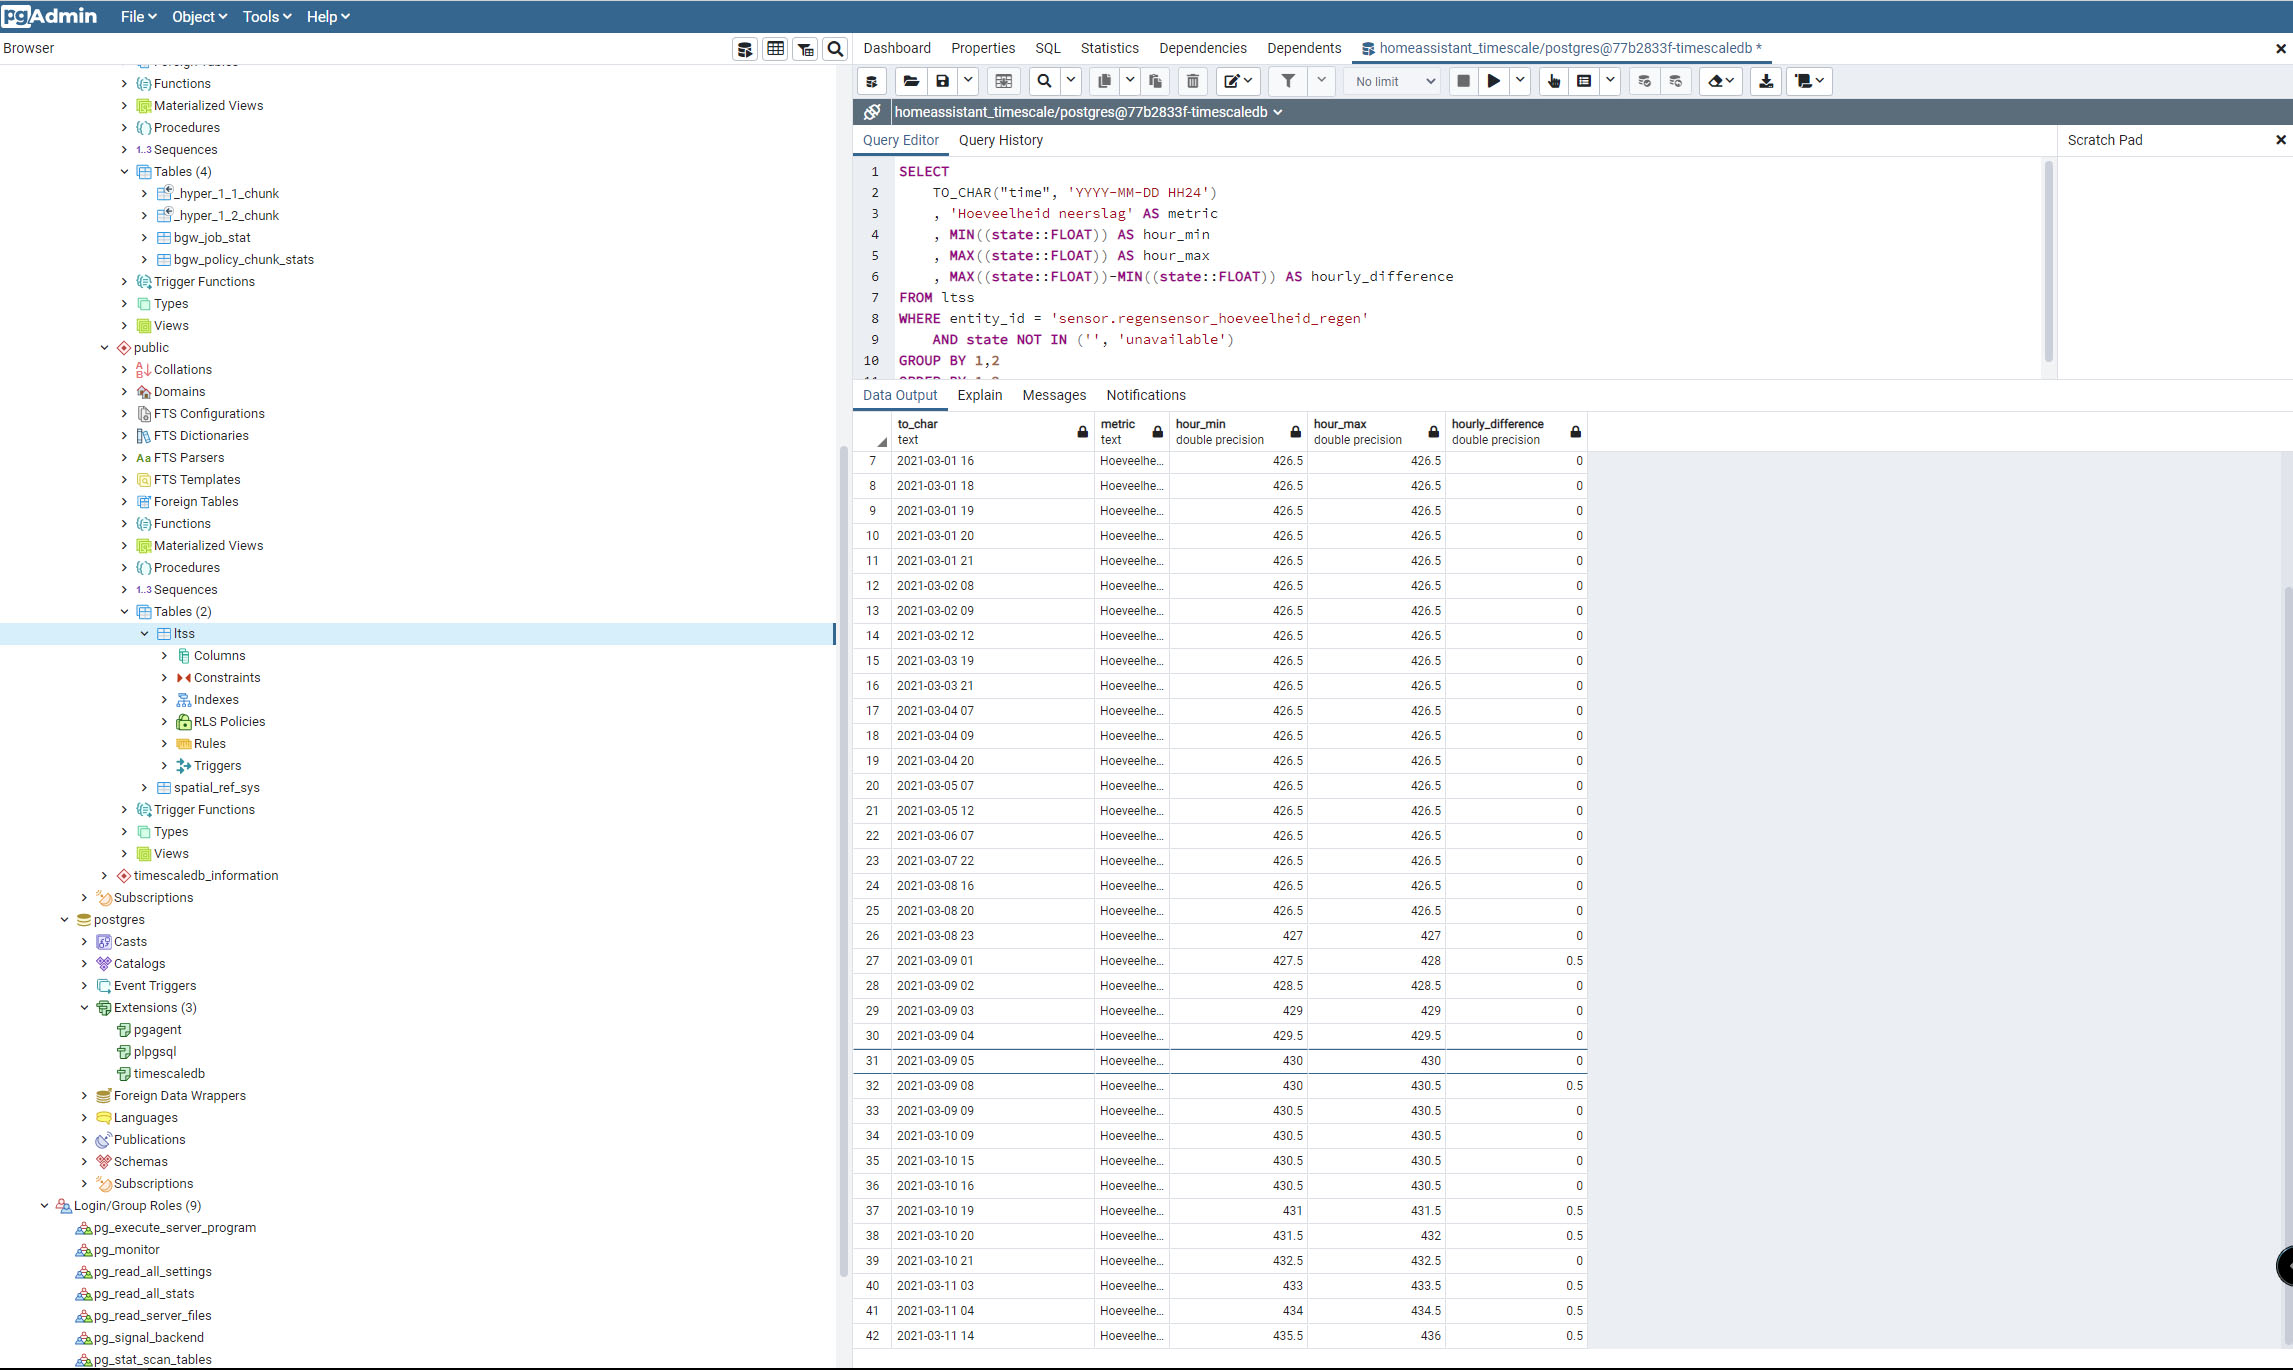
Thats because we used 12h format instead of 24h format. Sry
Use HH24 instead of HH
Can you order your second query by time?
At the moment it looks pretty valid to me. Most of your data increases in steps of 0.5 per hour if there is an increase
Good tip @Expaso , but I don’t think so in this case.
Only values that can be converted are converted by ::FLOAT.
We have already excluded non-valid float values by “WHERE state NOT IN (’’, ‘unavailable’)”.
What do you mean with “your query”?
What are your display settings for the graph in grafana?
Strange enough. I recently used almost the same query to determine the daily driving distance for my Toyota Corolla based on the total distance. And it works very well
With your query I’m meaning your suggestion in post #2 of this thread (with a correction for 24H).
Have you looked at the table from post #12?? It must be clear for you that the data are not corresponding with each other! So the differences are already present before Grafana is coming on the foreground.
I saw your graph of daily driving distances. It looks as if everything is oke in this graph. I don’t understand all this. There must be something we are overlooking.
Sorry, but somehow what you write just seems increasingly rude to me. :-/
Of course I have looked at your table and also understood that there are differences. But without concrete information about how which values were determined, they are useless.
OK, now I know how you determined the values for “Query proposed by Simon”. How do you get the values under “Calculated from ltss table”?
The calculated values from LTSS table are obtained as follows:
I took the values from the table represented in post #10 (the PgAdmin query). I looked at the time that precipitation data made a change and made timeslots of 1 hour. Precipatation taking place in the same hour is added to each other (the same hourly period).
In the Table of post #12 data of March 10 (from 19:00-24:00) and March 11 (from 00:00-15:00) are combined).
Because of the fact that the database is GMT-time formatted and made a correction of 1 hour to obtain CET-time format.
The query itself is absolutely correct. But it takes into account only changes within a time bucket, not beyond/before it. Because of the structure of your data you then get this:
Some corrections on your table:
GMT 19:00 mm precipitation: 430.5
GMT 20:00 mm precipitation: 431.5 DIFFERENCE: 1 mm
GMT 20:00 mm precipitation: 431.5
GMT 21:00 mm precipitation: 432.0 DIFFERENCE: 0.5 mm
GMT 21:00 mm precipitation: 432.0
GMT 22:00 mm precipitation: 432.5 DIFFERENCE: 0.5 mm
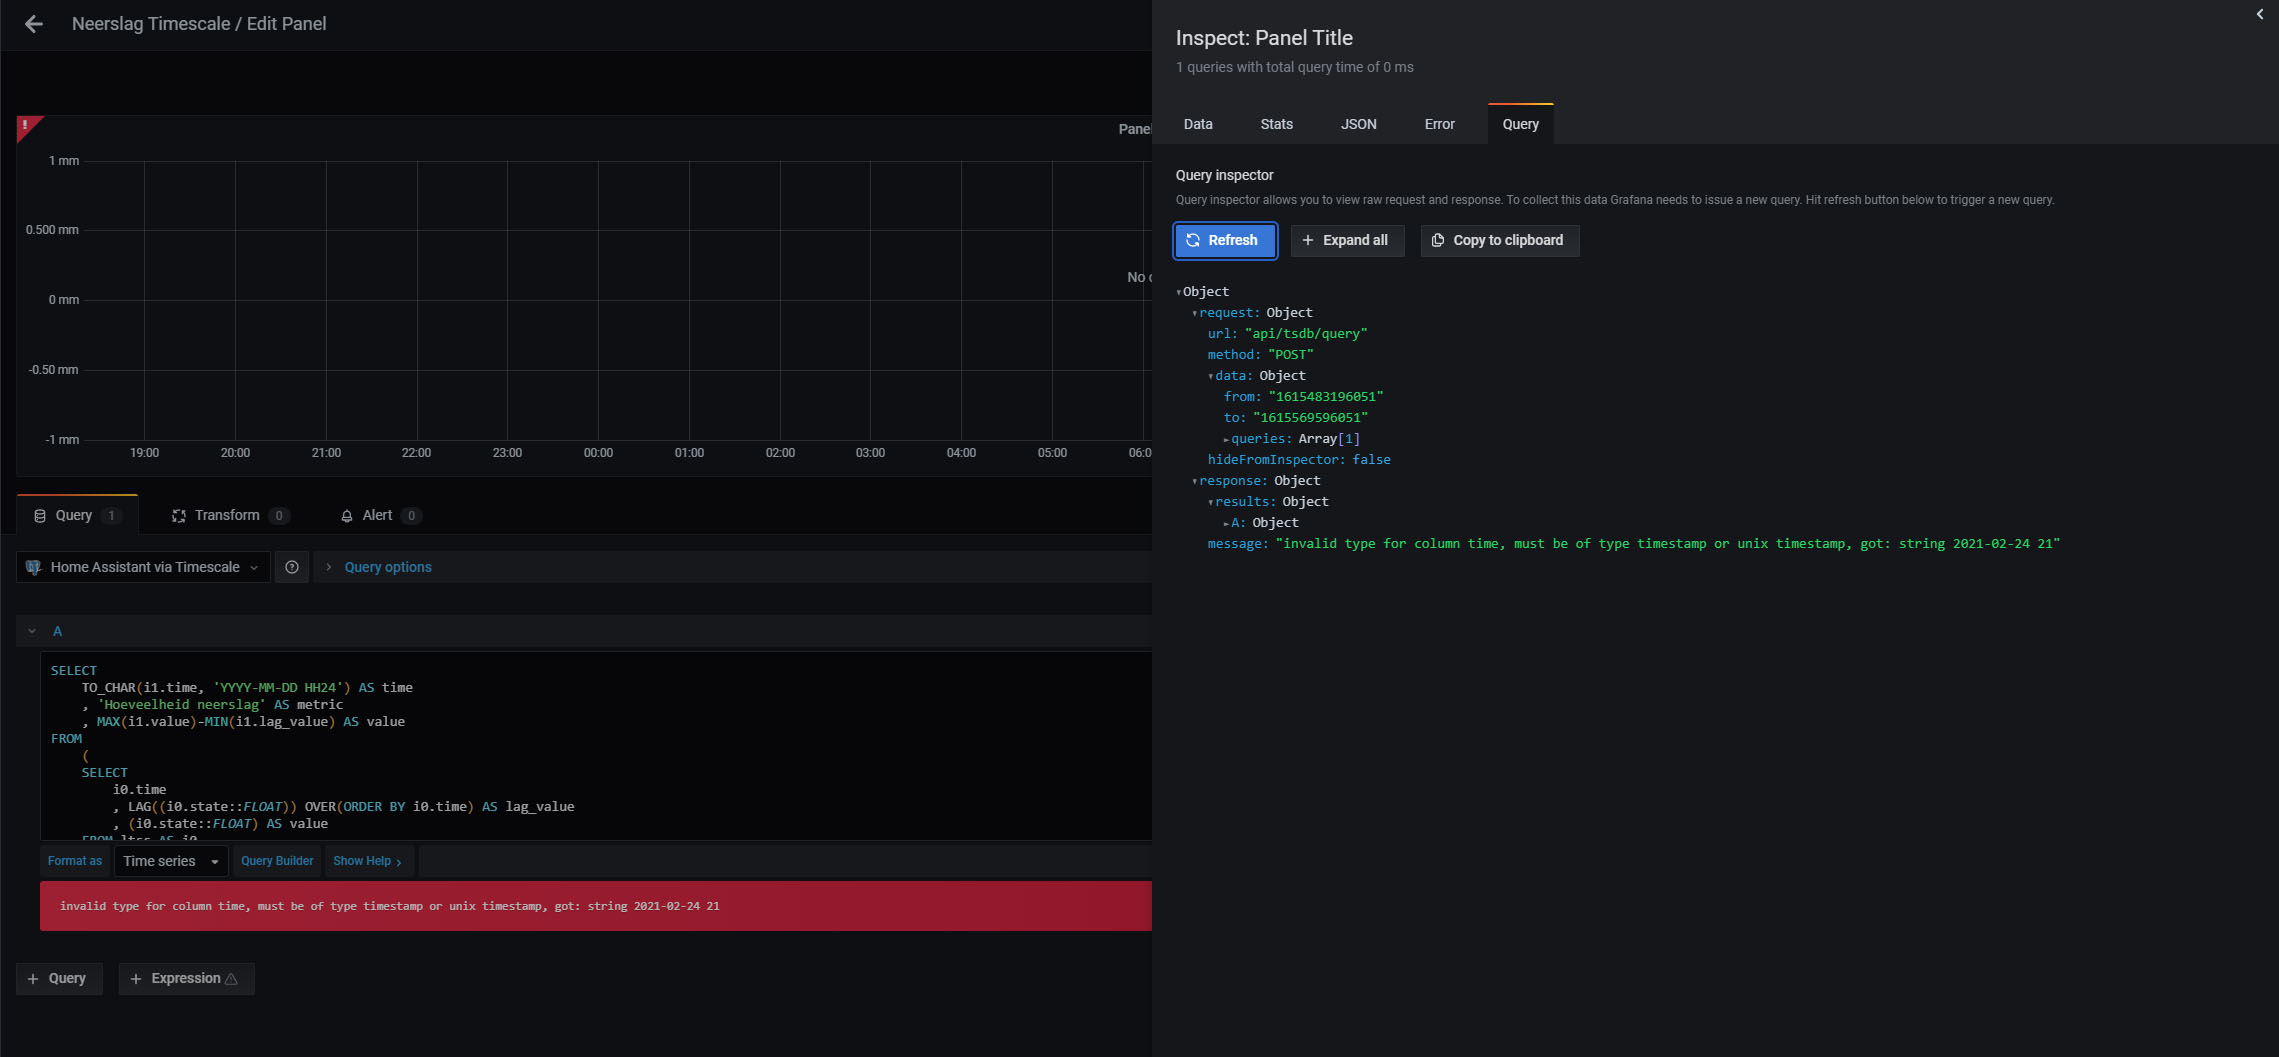
So you are right the actual way the calculation is done is not oke. I have to study the links you sent me. The data from post #10 are coming from home assistant. I have no influence on these data. So I have to make another query for the calculations and making the Grafana graphs. It would be very appreciated if you could help.
SELECT
    TO_CHAR(i1.time, 'YYYY-MM-DD HH24') AS time
    , 'Hoeveelheid neerslag' AS metric
    , MAX(i1.value)-MIN(i1.lag_value) AS value
FROM
    (
    SELECT
        i0.time
        , LAG((i0.state::FLOAT)) OVER(ORDER BY i0.time) AS lag_value
        , (i0.state::FLOAT) AS value
    FROM ltss AS i0
    WHERE i0.entity_id = 'sensor.regensensor_hoeveelheid_regen'
        AND i0.state NOT IN ('', 'unavailable')
    ) AS i1
GROUP BY 1,2
ORDER BY 1,2