Mine is still blank so I’ve change the state_class to measurement to see if that does actually make a difference. In the meantime I took out the
 statistics:
   type:  mean
and tweaked a few other settings to get the graph now looking like this:
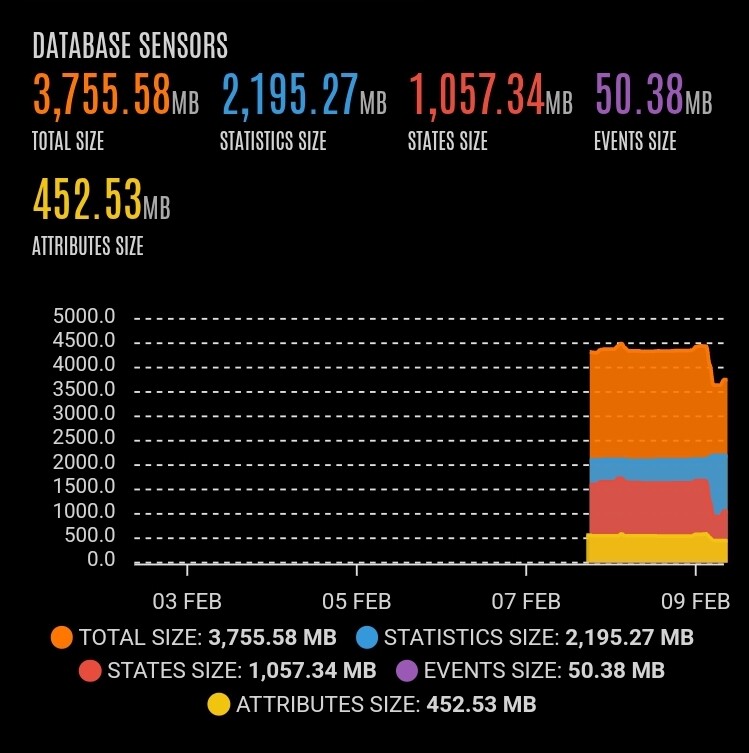
I’m not sure what the difference will be between the raw value and the mean value, but we’ll see.
EDIT
Sure enough, about an hour after changing the state_class to measurement the graph started populating data ![]()