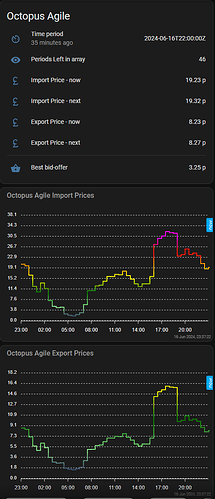
Octopus Agile - display tariff in graphs & tables, best import/export periods - all done using Node-RED and JSONata

I would expect the sequence table to be updated only with a successful API call after 17:30,and if the raw data is/was missing from the context, no sequence.

As long as the tariff array (96 records) is there in the flow context, you can try using the ‘manual’ inject node in the flow which should trigger a recalc of the computed tables to save you waiting until tomorrow afternoon.

yes I have manual injected numerous times - I always end up with Octopus Agile Input Binary timestamp in NR being updated to now, e.g. ‘green light. false at Feb 18, 22:16’ but no context (if I understand that term correctly) for any of the nodes within the Binary Sensor bottom box of the flow (Binary Sensor - create and manage dynamic switching schedules), whereas I can see context for every node in the upper 3 boxes of the flow. When I go to HA and try to find any sign of the sequence table it seems to not exist.

Update 24 hours later. I’ve finally realised that the friendly name is what is needed to bridge the gap between the table cards and the config nodes in nodered and my config node had nothing in friendly name. Populating that with octopus_agile_sequence_table gives me a sensor entity with visible attributes. Still have a blank card apart from headings but I’m stumbling towards the light :slight_smile:

update some minutes later - now realised that in Homeassistant I am able to change entity id from format nodered_bd4485c035f519e2 to octopus_agile_sequence_table, and this (rather than friendly name) finally sorts my issue.

@NickSee

Hi Nick

I have a bit of time to look at this - do you have any issues remaining or are you now up and running OK?

I am assuming that all the issues you had were down to problems with the sensor configuration nodes.

Hi Geoff, very kind of you to offer your time like that. I am all up and running with the fruits of your work thank you. The only usability issue I have is a very minor one: on PC the Octopus Agile Rates import column is perfectly rendered in green yellow red background with black text pricing. When I use my HA app on android, the same table is rendered with white pricing text which is consequently unreadable. My fault for being on Dark Mode on my Android. Is there any property I could tweak? My googlage hasn’t lead me anywhere productive on that one yet.
I am currently working on templates to do some decision making regarding charge slots, and getting my head around the jsonata logic that produces the import windows. In my use case I would want to make use of the 3 slots my (Growatt) inverter affords me (as opposed to having one long import chunk of time coming out of Octopus Agile Period since I’ve been looking at it) and I currently manually chose the cheapest combination of slots that will get me to a target SoC by the following morning. I mention this only because I’m conscious of all the thought that you have put into your current rules and I am probably duplicating chunks of effort here. I am busy designing ways to achieve balancing consumption profiles with SoC with the output of your sensors and with the solar forecast and enjoying a LOT of learning :slight_smile:

Good to know that it is all working at last.

The agile price table uses some basic html to modify the background colour. I stick to the default light mode, but I would guess that you can modify the foreground also, or just remove that bit of the configuration.

The flow is intended to provide the basic tariff array in context store, and to return the current values for each half-hour. The extra bits are there as a guide as to what can be done, but clearly it is there to be modified for individual use. I am still looking at SOC modelling and finding it very difficult with too many variables and unreliable solar PV forecasting. The current experiment is to capture long term all solar / load figures hourly for a year, then run them through different control models and Octopus tariffs (agile, flux, fixed) to see what happens. I have decided that, if it is viable, I will go for the Flux tariff as it is more predictable and therefore potentially more manageable than Agile.

There is always a lot of learning in this - the JSONata may be rather complicated so I’m happy to assist if you are tinkering with that in particular and need any explanation or help.

Best wishes!

I’ve just started to try and have a go at this, but am struggling massively.
I have installed all the pre-reqs and configured nodered correctly I believe as it has deployed successfully however I am seeing some error . I haven’t managed to find my export API yet, but got one for the import but I’m not seeing any of the sensors in HA

Can someone help me with where I’ve gone wrong please?

In the debug, I’m getting this:
15/06/2024, 00:25:52node: SC Oct Agile Pricesmsg : error

“Error: Invalid server config”

15/06/2024, 00:25:52node: SC Oct Agile Imp Binmsg : error

“Error: Invalid server config”

15/06/2024, 00:25:52node: SC Oct Agile Seqmsg : error

“Error: Invalid server config”

15/06/2024, 00:25:52node: Octopus Agile Pricesmsg : error

“Error: Invalid entity config”

15/06/2024, 00:25:52node: Octopus Agile Import Binarymsg : error

“Error: Invalid entity config”

15/06/2024, 00:25:52node: Octopus Agile Sequencesmsg : error

“Error: Invalid entity config”

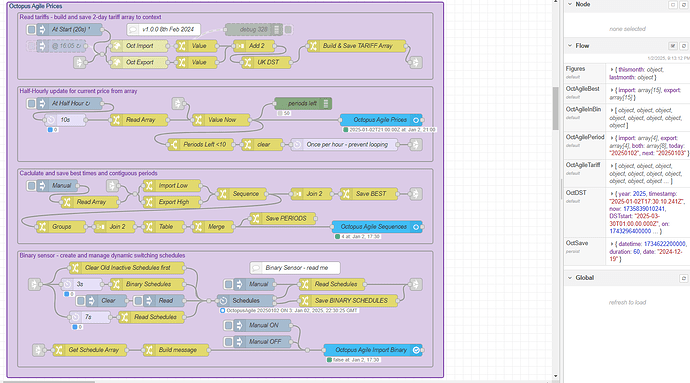
To communicate back to Home Assistant, this flow uses the WebSocket nodes (the nice blue ones). These sensor nodes each have a configuration node behind them, and all three configuration nodes are (should be) connected back to a single server node that manages the WebSocket / API connection back to HA.

Is your Node-RED as an HA addon, or stand alone?

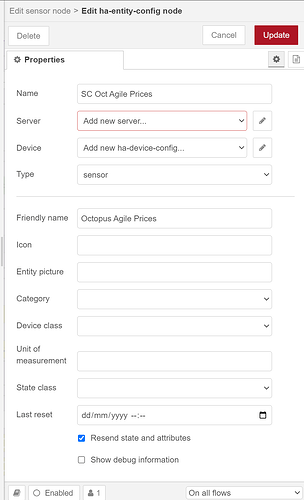
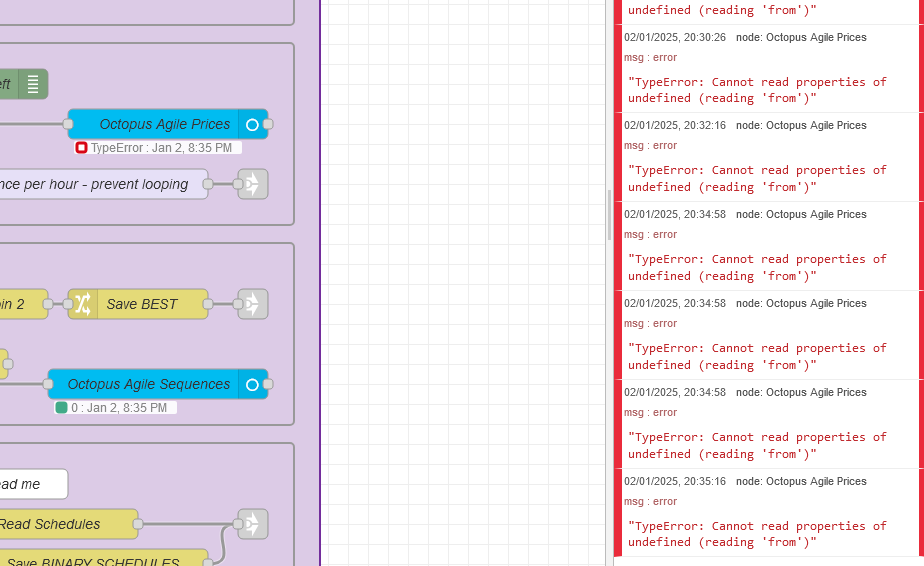
I see from your picture that you have a small blue dot top right of two of these sensor nodes, which means that you have edited them but not deployed the flow changes. Have you followed the installation instructions, created / checked your HA Server connection, and re-attached your working server to each sensor node’s configuration node?

The instructions are long-winded, but should cover every installation from the seasoned pro to someone who has loaded Node-RED for the first time. The important point is that, as is best practice, the flow comes with the HA server configuration removed, and it is necessary (absolutely vital) to ensure that you have your own HA server working, and then to attach this server to each of the sensor nodes (to the configuration node behind the sensor node to be precise).

Please do re-check the installation guide for “Connection to Home Assistant” and the “In full detail” part as a first step.

The good news is that your API call is working, and the ‘periods left’ at 44 looks sensible. Just seems to be the WebSocket connection issue.

In Node-RED, right hand debug window, select ‘context’ tab, expand the ‘global’ section, click on the RH refresh icon.
You should see a ‘homeassistant’ context variable, as a ‘homeassistant’ object with
states and services, and isConnected and isRunning both true.

double click on each one of the Octopus Agile (Blue) boxes currently showing “error”


then click on the pencil to the right of “Entity config”:

Where it says “Add new Server”, click the drop down and choose Home Assistant.
At the very bottom left corner of this window will have “Disabled”, single click it to be “Enabled”. Then top right “Update”.

Then check the bottom left corner is still “Enabled” if not single click to “Enabled” then “Done”.

Repeat this on the other two Octopus Agile “Sequence” and “Import Binary” blue boxes.

Make sure that you have updated the Import and Export with your regional info:

Double click on “Oct Import” Then the URL should be edited for your Region:

My region product and IMPORT example: https://api.octopus.energy/v1/products/AGILE-22-08-31/electricity-tariffs/E-1R-AGILE-22-08-31-A/standard-unit-rates/?page_size=96

Thanks @Biscuit and @angusc for your help - I ended up having to delete the Home Assistant server entity and recreate it. I’ve now got the sensors working (although I have 2 of each one, one with an _2 after it) and its pretty brilliant. Thanks :slight_smile:

I have been using this for months and it has been great. Yesterday it didn’t return any data. Before I fiddle and break it :grinning:, where should I look to see what the issue might be. I tried to update it by pressing on the manual button, but still no data.

Hi @bazcurtis

If you have daily bank ups set up on your HA installation you could simply restore.

Yes it is remarkably reliable and just does the job. Except when it breaks.

There was an issue about this time last year when the normal Octopus rate file update did not happen, was very late, or included corrupt data. I call 96 records in the API, being sufficient for two full days at two records per hour. On a couple of occasions I have seen duplicate records in the return, meaning that 96 records were only about 68 real records. There is a filter at the start to remove extra records, which can result in a partial data set.

Given the normal data reliability, and that there is not much that we can do if the data does not appear or is corrupt, there is no error-recovery built in, so if it stops working we can either wait and see if it works tomorrow, or some debugging is required.

First: Is Octopus data OK?
The website https://agileprices.co.uk/ can be used to select your region and tariff, and I can see that data is there for today (Friday) but not yet for tomorrow (Saturday) as expected as we are looking before 16:00.

If no data here - something wrong at the Octopus end of things!

Second: Is the API call returning OK?
Drop a Debug node into the flow, set to ‘complete message’ and connected to the Oct Import node, manually trigger the flow. The http request node should fire, and the output should show in the debug.
We are looking for

  • statusCode 200
  • payload.count - should be a big number (this is the total count of half-hour tariff records for the particular tariff going back to when it was first introduced)
  • payload.results - should be an array of 96 values

If the statusCode is anything other than 200, there is a problem with the API call. If the payload results is not an array of [96] records, then the the call has failed to return the values requested.

Third: Check the base tariff array in context.
In the debug window, in the Context tab, look for the OctAgileTariff variable, and expand to see the array item 95. This should be for the time period 22:30 to 23:00 (BST) for today (or for tomorrow after 16:00 update) and have both import cost and export cost figures.

If the API call is working, but the array is not correctly updating, then it is possible that the Export API call has failed. The code just assumes that both Import and Export calls will be successful, joins #2 returns, and builds the combined array. Should one API fail then the join node count will get out of step, and the table will not build correctly / at all. A redeploy / restart of the flow should reset this.

If all of this is OK, then the ‘problem’ lies further down, possibly with the output of the figures to graph / tables, and will required more debugging.

Thanks for the information @Biscuit. At the moment I have data from 18L30 to 22:30 for today. This data appeared at 4pm. I am pretty sure the issue will be on the Octopus side. I will take a look over the weekend following the above. I have a feeling it will fix itself by the time I get to look :slight_smile:

Can I tell the code to just get the import? I don’t need the export values.

Yes, but it needs a couple of patches.

If you are (entirely) happy to edit a couple of nodes by hand, this fix should work.

Edit the following nodes in the top group (Read tariffs) only:

  • Oct Export (http request node) and set to disabled
  • Add 2 (join node) and
    • remove ‘After number of message parts’ 2 (to leave this blank)
    • add ‘After a timeout following the first message’ as 10
  • Build & Save TARIFF Array (change node)
    • In the first ‘Set msg.payload’ rule, edit the J: JSONata code and replace all of this with the following (tip - use the three dots on the right to open the editor, click inside the code, use Control-a to select all, use delete to remove the old code, use copy and paste to insert the new code. Save)
  • Redeploy

Patch Code:

(
/* June 2024 - make Export optional, replace with '0' if does not exist */
/* UPDATED: June 2023 - include DST for local time */
/* create a merged array of import & export tariffs for each time period */
/* use DST switching timestamps to also create 'local time' and DST flag */

/* FUNCTION: extract date and time from ISO timestamp, first applying offset */
    $parsets:=function($timestamp){(
        $msec:=$toMillis($timestamp);
        $utcdate:=$substringBefore($timestamp,"T");
        $utctime:=$substringAfter($timestamp,"T");

        $tz:= $changing ? ($msec<$test ? $tzfrom : $tznext) : $tzfrom;
        $add:= $tz="GMT" ? 0 : $offset;
        $iso:= $tz="GMT" ? "+00:00" : "+01:00";

        $local:=$fromMillis($msec+$add);
        $localdate:=$substringBefore($local,"T");
        $localtime:=$substringAfter($local,"T");
        $isotime:=$substring($localtime,0,11);
        {"millisec": $msec,
        "utcdate": $utcdate,
        "utctime": $substring($utctime,0,5),
        "timezone": $tz,
        "localdate": $localdate,
        "localtime": $substring($localtime,0,5),
        "localiso": $localdate & "T" & $isotime & $iso
        }

    )};

    $changing:=dst.changing;
    $fromGMT:=dst.toDST;   
    $tzfrom:= dst.TZfrom;
    $tznext:= dst.TZtobe;
    $test:= dst.testvalue;
    $offset:=dst.DSToffset;

    $array:=payload.import#$i.(
        $from:=$parsets(valid_from);
        $upto:=$parsets(valid_to);
        $export:=%.export[$i].value_inc_vat;
        {
            "from": valid_from,
            "upto": valid_to,
            "import": value_inc_vat,
            "export": $exists($export) ? $export : 0,      
            "date": $from.utcdate,
            "timefrom": $from.utctime,
            "timeupto": $upto.utctime,
            "localdate": $from.localdate,
            "localfrom": $from.localtime & " " & $from.timezone,
            "localupto": $upto.localtime & " " & $upto.timezone,
            "dstchange": $from.timezone != $upto.timezone,
            "isofrom": $from.localiso,
            "isoupto": $upto.localiso
        }
    );

    $array^(from)

)

This turns off the Export API call and permits the first join to work with just one return. Most of the code still works OK, but the HA sensor nodes will error as some of the required attribute values would now be missing, so this patch adds in 0 value for missing export. Export values will therefore exist as zero rather than ‘unavailable’ or just missing.

Disclaimer: I have tested this but naturally it is a quick fix and has not been fully checked over a period of time.

Thanks, I will try that. As I predicted, it fixed itself before I got a chance to see what was wrong. Working in IT for a long time, if I have learnt anything, if I didn’t change anything, give it some time, the other end will fix itself.