Octopus Energy Integration: Display graph of usage?

In simple terms, Home Assistant uses ‘sensor entities’ that hold ‘state values’, almost all of which are created (registered with HA) by the various ‘integrations’. The creating integration (some of which are built-in) is then responsible for updating the entity state.

Here, we are using the Octopus Energy (Bottlecap Dave) integration. There is quite a lot going on in this integration, and it can be worth reading the documentation if you want to get the most from it. To get a graphical display of usage to work requires many things to be set correctly.

The entity sensors we require here are the previous accumulative consumption (electricity / gas) and the documentation for this can be found at

https://bottlecapdave.github.io/HomeAssistant-OctopusEnergy/entities/electricity/#previous-accumulative-consumption

Note the warning message - the latest data is always for yesterday and may not arrive until very late in the day.

I note that in the latest version 10+ we now have “latest available data timestamp” attribute in this sensor, which should indicate if the consumption values now relate to yesterday (updated) or the day before (yet to update)

Since there is a limit on how many API calls can be made to Octopus Energy each day, the call to update the previous consumption figures will clearly only happen infrequently.

https://bottlecapdave.github.io/HomeAssistant-OctopusEnergy/faq/#how-often-is-data-refreshed

The integration also includes a service call that can be used to force a refresh (useful where you have just added the integration and would like existing data to be loaded into the sensors).

https://bottlecapdave.github.io/HomeAssistant-OctopusEnergy/services/#octopus_energyrefresh_previous_consumption_data

To get the data for yesterday to arrive into the sensor

  • Octopus has to read the meter and update your account meter reading history. This only happens during the early morning to late afternoon
  • The integration has to make the necessary API call to obtain the latest meter readings / consumption. This only happens every 30 minutes or so.
  • The integration has to process the data and update the sensor.

My electricity consumption has only just updated, and I am still waiting for the gas figures. For most days, I only get to see “yesterday” for gas during the late afternoon-evening, and yesterday my gas figures updated just before midnight, which makes for little practical use. For this reason, the integration configuration allows for changing the previous consumption days offset from 1 (yesterday) to 2 (the day before yesterday) or greater - which would show a full day of figures all day, but for the day before yesterday.

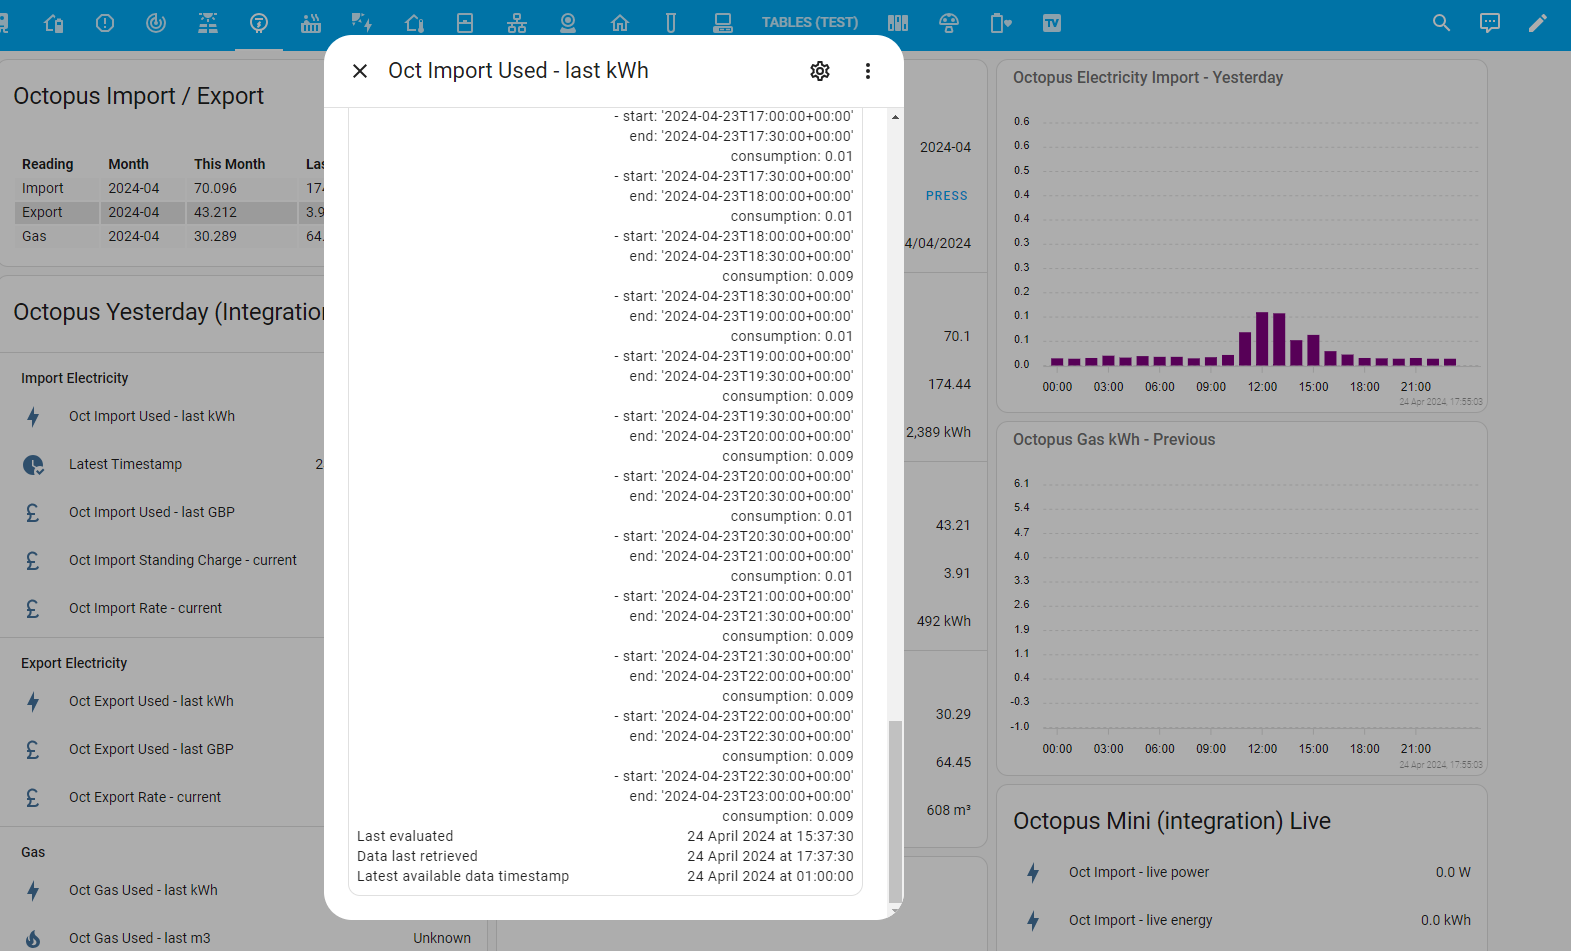
So… here is my latest Octopus Electricity (Import) previous consumption sensor - attributes. You will see that it was last evaluated at 15:37, which is when the graph actually updated with yesterdays figures because the integration actually found something new. The data was last retrieved at 17:37 (which is the integration just going around every 30 minutes looking to see if anything has changed). And the ‘latest available data timestamp’ shows 01:00, which is midnight last night (UTC - BST difference) when the end of yesterday’s figures comes to (allowing for the fact that the consumption figures end at 23:00 yesterday and not midnight).

I am sure that Albert Einstein would have no problems at all understanding this ‘smart meter’ stuff.

I think there must be something wrong with the comms with Octopus, as there’s nothing sensible in the “previous accumulation consumption” entity. (There are three - total, offpeak and onpeak and a similar effect is on all of them…so probably no surprise that I haven’t got a graph

There is, as I said, a lot going on in this integration, and it is worth going through the documentation if you want to get the best from it (and if you want to get it to work).

If we look at the / each electricity meter device for each account, there are 21 sensor entities created by the integration.

  • current rate
  • previous rate
  • next rate
  • current day rates
  • previous day rates
  • next day rates
  • off peak
  • previous accumulative consumption
  • previous accumulative consumption (peak rate)
  • previous accumulative consumption (off peak rate)
  • previous accumulative cost
  • previous accumulative cost (peak rate)
  • previous accumulative cost (off peak rate)
  • previous consumption day rates
  • current consumption
  • current demand
  • current accumulative consumption
  • current accumulative consumption (peak rate)
  • current accumulative consumption (off peak rate)
  • current accumulative cost
  • current accumulative cost (peak rate)
  • current accumulative cost (off peak rate)
  • tariff overrides

This is very impressive, however for someone like myself who is on standard rate, there is no peak and off peak. Hence my peak rate and off peak rate sensors are all disabled and do not work.

The current rate comes from my tariff. On an Agile tariff, previous and next make sense, on a fixed rate tariff they don’t - again these sensors are disabled and/or do not work.

The current consumption figures all come from my Octopus Mini - and if you don’t have one of those then nothing will appear in all of these sensors.

The previous consumption figures all come from the smart meter. If you don’t have a smart meter, or if the integration cannot work out that this is a smart meter, then it cannot pull the smart meter readings (they don’t exist).

For your sensor in your picture, which is previous accumulative consumption (off peak), the docs say this sensor (state value) is

The total consumption reported by the meter for the previous day that applied during off peak hours. This will only be populated if you’re on a tariff with two available rates.

Assuming you have a smart meter
Assuming you have a tariff with off peak periods
For yesterday, assuming you consumed 1.92 kWh during your off peak period (say 02:00 to 05:00) then sometime today the integration will update this sensor state to report that yesterday, off peak, you used 1.92 kWh.

If you look at the documentation, you will also see that this ‘off peak’ sensor does not have an attribute array of consumption figures. If you want a nice graph of consumption, then only the previous accumulated consumption sensor has the charges attribute holding the consumption array (from which we get the graph).

For reference see:
https://bottlecapdave.github.io/HomeAssistant-OctopusEnergy/entities/electricity/#previous-accumulative-consumption

In simple terms, you can’t graph 1.92 kWh.

You can graph the previous_accumulative_consumption (charges attribute) array.

Here is my sensor (previous accumulative consumption)
Here is the state value - 1.074 kWh used yesterday

Here are the attributes, including ‘is smart meter’ - true, and ‘charges’ - which holds an array of consumption figures.
That is what we are plotting in the graph.

And yes, if you look closely, the periods start at 2024-04-24T23:00 (this is UTC), and the array then covers 2024-04-25, which happens to be yesterday, and my graph works.

Here is a copy of my current, working, configuration. You only need to change the xxxxx_xxxxx part to match your mpan and meter serial number.

type: custom:apexcharts-card
header:
  show: true
  title: Octopus Electricity Import - Yesterday
show:
  last_updated: true
graph_span: 24h
span:
  start: day
  offset: '-1d'
series:
  - entity: >-
      sensor.octopus_energy_electricity_xxxxxxxxx_xxxxxxxxx_previous_accumulative_consumption
    data_generator: |
      let array = entity.attributes.charges;
      let final = [];
      let i=0;
      let j=0;
      for (i=0; i<array.length-1; i=i+2){
        final[j] = [new Date(array[i].start).getTime(), array[i].consumption + array[i+1].consumption];
        j++;
      };
      return final;
    type: column
    color: purple
yaxis:
  - min: 0
    max: '|+0.5|'

I’m sure the data_generator code could be refactored to make it neater…

Thankyou - that was really helpful. I really appreciate you taking the time to explain this - and I have discovered a useful new area of the Home Assistant site - the Developer Tools ‘State’ page! I checked that, and I have data in there, for the accumulative consumption, just like you do. I checked the code I have in the the card, and it looks correct. I carefully checked the sensor name, in case I have any syntax errors, and it looks perfect. So I copied/pasted the sensor name from the ‘States’ page into the Card code, and lo and behold a chart appears!! So I really don’t know why that is - maybe there is a zero where there should be a letter O or something like that. The chart is blank, but I’m guessing that’s because it’s waiting for new data to be uploaded, so I’ll give it 24hours and see if that data appears in the chart, but it’s certainly looking like we’re getting somewhere!

It’s working! the graph has now appeared. And I understand a bit more about Home Assistant than I did yesterday. Thankyou for all your help!