@Wexfordman - Just saw your post and the info from Oilpal. It made me think that the calculation in the scrape code is not correct for your tank.
I have a cylindrical vertical tank, so the radius is constant and the sensor measures the height, so Pi x r² mulutplied by height gives me the volume.
But your cylindrical horizontal tank has a different area at each height, so the maths is more complex to get the volume - it’s not a linear relationship between height and volume.
The config you posted is assuming your tank is a rectangular tank - its just multiplying height by a fixed width and length.
This might help with the calculations:
Not sure how you then turn that into a value template…
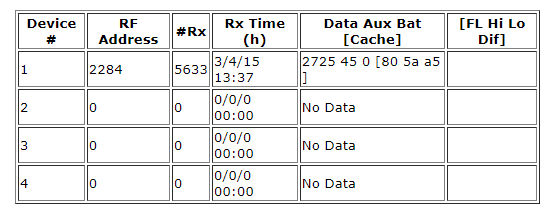
Hmm. So I have the sensor now but its shows some wacky readings with a depth of -35184 litres. I can see why that is. My table is different in data entered to that above.
I suspect that 2725 is temperature and 45 is depth and I can see the temperature change on the sensor which makes sense as night is approaching. If that is correct I need to change select: ‘table:nth-of-type(2) td:nth-of-type(5)’ but to what as to my mind I am looking at the 2nd element of the 5th column. Or am I missing something (highly likely)
If your sensor is different and you need the second (Aux) field, you need to change line 57 in your config (as per your image you posted)
from
{% set tank_depth = modem_values[0] | int %}
to
{% set tank_depth = modem_values[1] | int %}
Might be worth double checking your tank depth with a dipstick to confirm. I’ve had spurious readings before when the battery in the sensor was getting low. The measurement is cm from the sensor to the oil surface.
Thanks so much. That is looking more like it. I am starting to understand some of this at least. I will check the tank as you suggest and also correct the measurements to match my tank now its looking in the right ballpark. For the record for others I am using a Olive Oil monitor from eSmartmetrics which shows up on the diag webpage as a TEK608A device
Hi @c0rnflake
I have my OilPal sensor integrated into HA thanks to your script above but I’d love to enhance it like you have above using the graphs, estimated days left and battery level of the sensor.
Can you please share some details on how to enhance it?
I have just set up a new HA incidence again after using it in the past. I forgot how fiddly it can be and the configuration.yaml requiring very precise inputs to be registered, especially with those changes from 2022 the version of HA and how it needs the code it uses slightly differently I thought I’d help here with my vanilla updated version for others. Which seems to have been accepted and given me a reading, with those default values.
With the Oilpal app stopping working I needed to integrate something and it was great to see this. Thanks @c0rnflake for the original code and @PatrickT1 for guide to updating it.
I have a horizontal cylindrical tank so the maths changes quite a bit.
We need to know the radius and length of the tank, then if we know, with the sensor, the height of the oil in the bottom of the tank we should be able to calculate its volume.
I’m going to play with the code a bit and try to get things right and will update if I can see its working.
Below is the original script intended for a vertical cylinder oil tank (when tank type set to 1) and updated as little as possible to make it work with the latest version of home assistant, as below.
It took me a little time but I think I have figured the code for a horizontal cylinder oil tank.
NB - I am in the UK and use the original oilpal sensor the same as the OP. Therefore scraped values might not be the same for your sensor if it was from a different manufacturer.
A lot of the ideas for the code and what would work within HA without having to involve any python or extra addon programs for the trig came from the following other tread and thanks to @Petro
Also you should note most Horizontal tanks aren’t a perfect cylinder and have elliptical ends I used the following website and his excel spread sheet to compensate and try to get a better estimate - i.e. the length of my tank is 180cm so for its height this would only hold 2000L, however I know from the documentation it holds 2500L (which is quite a underestimate) so I increased the length to 220cm on the spread sheet to account for this and increase the overall volume until I hit 2500L (marked in pink below) and I think its probably a little more accurate for me. I’ll keep an eye on it though especially at fill times.
You’ll have to discover the IP address of your device yourself, via your router home page and perhaps its DCHP / LAN settings - once you find the ip address if you pop it into a web browser you should see the below if you click the sensor data link on the left.
Below is the code, which works fine with my vanilla home assistant setup as part of a TrueNAS App. I’ve not included a card as yet - as doing so can confuse things if you haven’t already added the below and made sure it appears within “settings” click, “devices and service” then “entities” then you have bigger issues to sort.
# Sensors
scrape:
#Edit below IP address to your oilpal/watchman sensor's IP address's sensor data page - this must be found via your home routers DHCP info.
  - resource: http://192.168.0.7/diag.htm
    scan_interval: 60
    sensor:
      - name: Estimated_Oil_Remaining
        unique_id: estimated_oil_remaining
        select: 'table:nth-of-type(2) td:nth-of-type(5)'
        unit_of_measurement: 'Litres'
        # units for a horizontal oil cylinder tank measured as height (of sensor from bottom of tank - which "should" be 2 times the radius but not always), radius and length which should be in cm - width isn't really involved for a horizonal cyclinder
        value_template: >-
          {% set modem_values = value.split(' ') %} {% set tank_temp = modem_values[1] %} {% if tank_temp != "Data" %}

            {% set tank_depth = modem_values[0] | int %}
            {% set tank_type = {
              "value": 1
            } %}
            {% set tank_dimentions = {
              "height": 120,
              "radius": 60,
              "width": 130,
              "length": 220,
            } %}
            {% set tank_area = {
              "value": tank_dimentions.radius ** 2 * acos((tank_dimentions.radius - (tank_dimentions.height - tank_depth)) / tank_dimentions.radius) - (tank_dimentions.radius - (tank_dimentions.height - tank_depth)) * sqrt(2 * tank_dimentions.radius * (tank_dimentions.height - tank_depth) - (tank_dimentions.height - tank_depth)**2),
            } %}
            {% if tank_type.value == 1 %}
              {% set tank_volume = {
                "value": (tank_dimentions.length * tank_area.value) / 1000,
              } %}
            {% else %}
              {% set tank_volume = {
                "value": (tank_dimentions.height - tank_depth) * tank_dimentions.length * tank_dimentions.width / 1000,
              } %}
            {% endif %}
            {{ tank_volume.value | round (0) }}
          {% else %}

            {% if states.sensor.oilpaldata.state == "" %}
              Waiting for first reading
            {% else %}
              {{ states.sensor.oilpaldata.state }}
            {% endif %}
          {% endif %}
Here’s a post of my login overview without having to even add any custom code for a card.
Here’s if I click the card the graph I get (the large ups and downs are all test results).