Wow … Just what i was looking for… Started using HA today… Integrated it with Fibaro HC2, Philips HUE and NetAtmo so far… This integration with PfSense is a dream come true!! Thanks for taking time posting this!
2 Likes
I have tried everything in this thread. But i still got this unknown on my sensors. What has gone wrong?

Did you install the required support script onto your pfSense device? You need to put the following script into /usr/local/www on your pfSense device.
I use OPNsense and will see if this works.
I have the same issue, did you get it to work?
Maybe someone else know this? The error I see in the logs are:
Timeout for command: python3 /config/custom_components/pfsense_fauxapi/function-gateway.py
EDIT: got this fixed by adding the port to the IP of the pfSense server (default 10443)
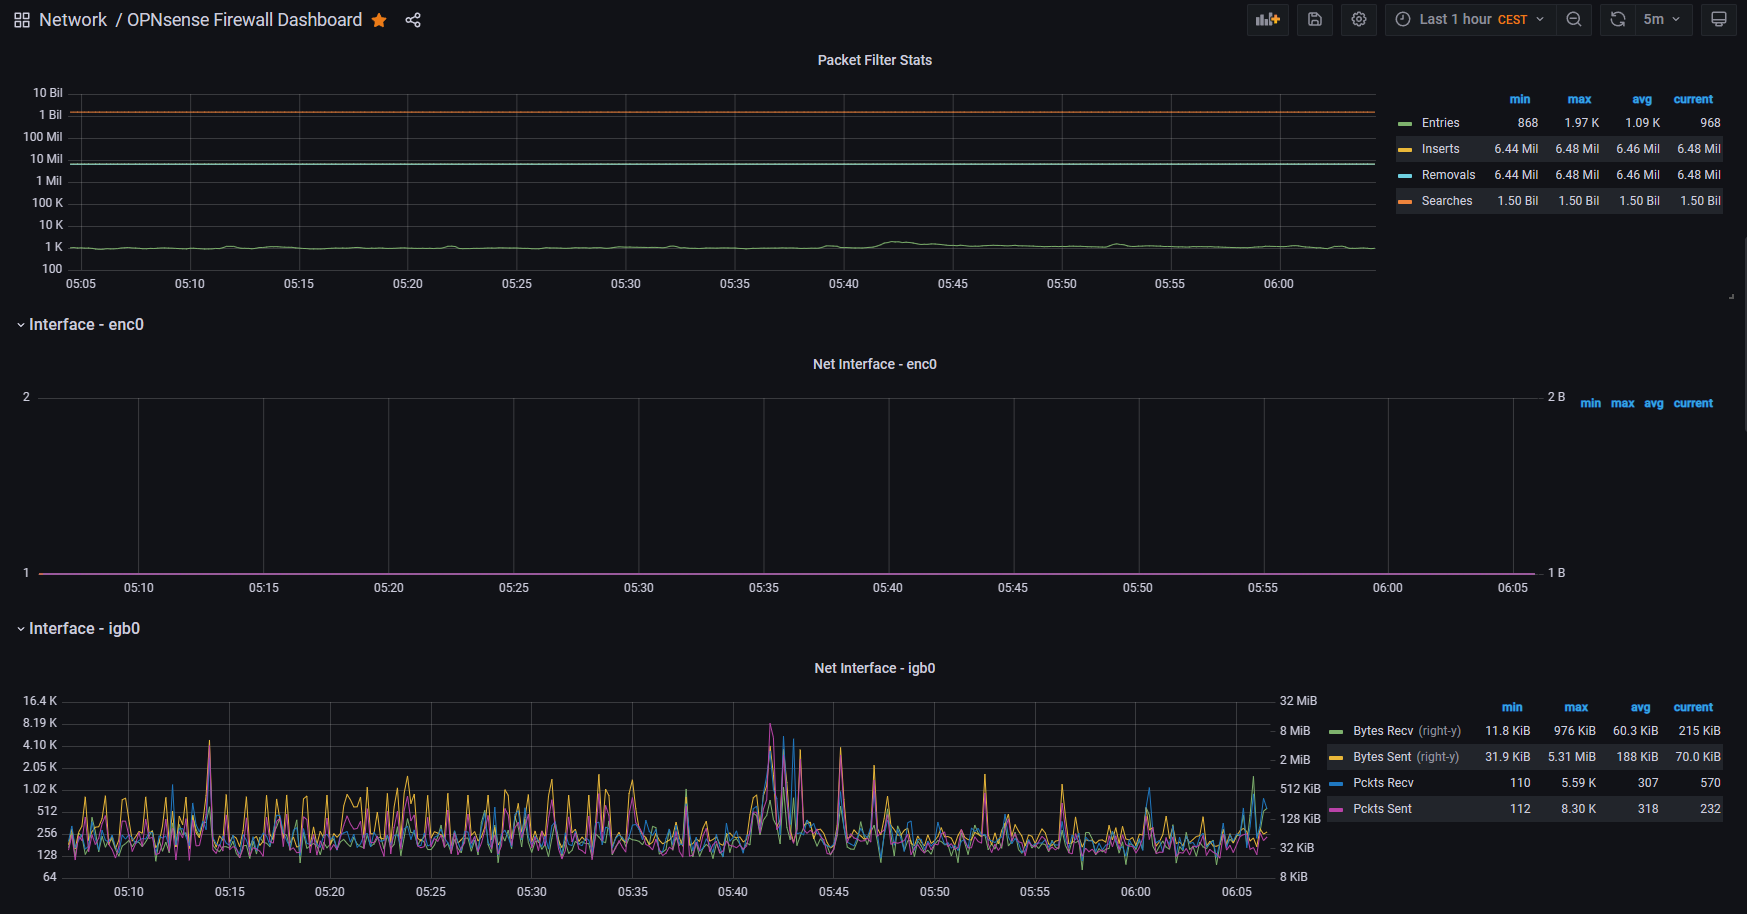
If anyone is interested in an alternative approach, there is a telegraf package for pfsense that will dump data into an influxdb database. From influxdb, there are a ton of options. I’m using influxdb sensors for the basic stats, and then using grafana for the full dashboard. There’s an awesome pfsense dashboard available to download already.
Here’s a few influxdb sensors for the proxmox box thatI use to host pfsense (proxmox will also dump to influxdb):

And here’s a few shots from grafana. This is the community dashboard available for download:


5 Likes
Would you mind to share some details how to make it running?
For sure. I’ll post up more details later. The stack is pretty well documented (TICK, or Telegraf+Influxdb+Chronograf+Kapacitor), so Google it. Basically, get influx going, install telegraf on pfsense, then visualize the data. I use grafana, but chronograf is also great.
Edit:
-
First things first, get influxdb up and running somewhere (the “I” in the TICK stack). You can use the home assistant addon, you can spin up a docker container on another host (what I’m doing) or any other method available.
-
If you are using the addon, then Chronograf is included in the package. If you are not using the addon, then I HIGHLY reccomend you also spin up a a Chronograf container (the “C” in the TICK stack). Chronograf is an awesome data visualization tool for Influxdb. But even better, it’s also a web based admin GUI. It makes things like adding new users and databases a breeze. The visualization parts also make it super easy to quickly query the data in a pinch. Use Chronograf to create new database called “pfsense” and make sure you give your non-admin user read and write access:

- Now it is time to install Telegraf (the “T”). This is the tool that will pump data into your new Influxdb that you setup and administrate in Chronograf. Go to your package manager in the GUI, look for Telegraf, and install it:


- Configure Telegraf to send data to your new Influxdb database. Its as simple as services>telegraf and then fill in the details:

- To visualize the data you can use Chronograf. But I like Grafana because it is super easy to imbed graphics in lovelace, or just click right into the environment from the side bar. If you use Grafana, then download the pfsense dashboard and install it:

- Bonus points: if you want to pull in a few values from you Influxdb source, you can create influxdb sensors. The configuration is a bit of a bear, but once you get the syntax right it is pretty straight forward. You can use Chronograf to help you construct a query.
With this stack you can start getting all kinds of data from other sources. I have two proxmox hosts that dump into other databases. I have a few linux containers and another host where I also use Telegraf. Oh, and the “K” is for Kapacitor. You can use this last tool in the stack for reporting and alerting. I haven’t leveraged it too much yet since I can also do this in node-red or home assistant, but it is there and seems really powerful.
7 Likes
Did ya get it to work? Another opnsenser here.
No, but I will try the method above. TrueNAS has a Grafana plugin so I will give it a go.
BTW, I think OPNsense beats all routers out there.

I got everything working except for the gateway stats. I cannot figure out what I am missing. I did make the change in function-int-wan.py, but still noting.
Same problem here
Just updated my repo version of this in beta and it is working for me.
Did you add your gateway IP address to the relevant configuration.yaml?
I had to change the IP of the your.gw.ip.address to the Monitor IP address of my WAN (8.8.8.8 in my case.) Then it worked.
1 Like
I guess I was being a little slow, but I figured it out. Thank you for the help.
Thanks a lot for this, I used it for OPNsense: had to adapt it, but it was pretty easy, and it works beautifully.


1 Like
Is that the HA Grafana integration or separate docker installation. I can’t install the pfsense Dashboard into, since under “Library panels” I have “No library panels found”.
It’s the HA integration. In order to import the dashboard you click here (check the red arrow):

Then either you upload the json file or copy&paste in the last text box.

1 Like
Thank you! It worked!
I know it works. Glad you solved it. 