HI, thanks for the amazing work! I just discovered this project and I am now working on replacing my mini graph cards with it, as it is more useful for me.
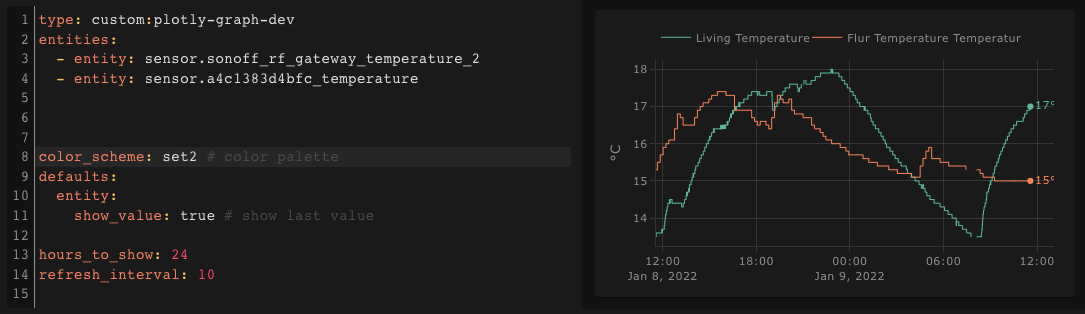
What I wanted to ask if it may be possible for you to add an option to change the line color based on value. The example of what I have now:
Happy to hear you find it useful!
Painting a single trace with multiple colors is unfortunately not possible with the underlying plotting library, I don’t think it will ever be possible
Hi,
I just installed your card (nice work by the way) and everything is working fine on MacOS 12.1 with Chrome including range selection.
But on Safari when trying to change the range to a wider selection, the only part of the graph showed is from the original range although data for this timeframe is present in the Home Assistant database (for instance, when starting with a 24h view and trying to show a 7 days view, only the original 24h view is showed).
The inspector output this error message:
“Unhandled Promise Rejection: Error: Error computing range substraction. Please report an issue in the repo of this card”
Could you put this in the github issues instead?
Please add the contents of the console between “----ERROR TO REPORT-----” and the “error computing range subtraction” message and I’ll give it a look on the weekend.
Great new card. I started to convert some of the apexcharts cards I had to this new setup.
Couple of questions:
in apexcharts, it’s possible to group values by duration and return the average. So for instance I may have a sensor updating every 30 seconds, by just take the average for each 2 minutes interval. How would you do this using lambda functions ?
Thanks
Nice idea! This is not possible at the moment, but I could allow to return an array for the Z axis in the lambdas.
Would you mind requesting this here? This way I won’t forget to take a look at this when I get some free time.
I have some questions:
First, can I replace the left text with my custom text? (steps)
Also: Is it possible to make the time-interval “today” (like from 00:00 until now),
Also2: In he current setup the buttons on top can go above the title, how can I prevent that?
Saw this as well. One more: Would be great to have a non overlapping name of the defined graph (e.g. if you have more than one per card), but one card-title as in HA standard (h1.card-header) additionally.