so i just wanted to post here because im also from Graz. I created sensors following way. It works really good
configuration.yaml
sensor:
  - platform: rest
    name: Pollen Raw Data
    resource: https://www.polleninformation.at/index.php?eID=appinterface&pure_json=1&lang_code=de&lang_id=0&action=getFullContaminationData&type=gps&value[latitude]=46.628&value[longitude]=14.309&country_id=1&personal_contamination=false&sensitivity=0&country=AT&sessionid=
    scan_interval: 10800 # every 3 hours
    value_template: "{{ value_json.success }}"
    json_attributes_path: "$.result"
    json_attributes:
      - contamination
template:
  - sensor:
      - name: "Pollen Birke"
        state: >-
          {% set levels = ["keine Belastung", "gering", "mäßig", "hoch", "sehr hoch"] %}
          {% set p = state_attr('sensor.pollen_raw_data', 'contamination') | selectattr('poll_title', 'search', 'Birke') | list | first %}
          {{ levels[p.contamination_1 | int] if p is defined else 'unavailable' }}
        attributes:
          raw_value: >-
            {% set p = state_attr('sensor.pollen_raw_data', 'contamination') | selectattr('poll_title', 'search', 'Birke') | list | first %}
            {{ p.contamination_1 if p is defined else 'unknown' }}
          title: "Birke"

      - name: "Pollen Esche"
        state: >-
          {% set levels = ["keine Belastung", "gering", "mäßig", "hoch", "sehr hoch"] %}
          {% set p = state_attr('sensor.pollen_raw_data', 'contamination') | selectattr('poll_title', 'search', 'Esche') | list | first %}
          {{ levels[p.contamination_1 | int] if p is defined else 'unavailable' }}
        attributes:
          raw_value: >-
            {% set p = state_attr('sensor.pollen_raw_data', 'contamination') | selectattr('poll_title', 'search', 'Esche') | list | first %}
            {{ p.contamination_1 if p is defined else 'unknown' }}
          title: "Esche"

      - name: "Pollen Zypressen"
        state: >-
          {% set levels = ["keine Belastung", "gering", "mäßig", "hoch", "sehr hoch"] %}
          {% set p = state_attr('sensor.pollen_raw_data', 'contamination') | selectattr('poll_title', 'search', 'Zypressen') | list | first %}
          {{ levels[p.contamination_1 | int] if p is defined else 'unavailable' }}
        attributes:
          raw_value: >-
            {% set p = state_attr('sensor.pollen_raw_data', 'contamination') | selectattr('poll_title', 'search', 'Zypressen') | list | first %}
            {{ p.contamination_1 if p is defined else 'unknown' }}
          title: "Zypressen"

      - name: "Pollen Erle"
        state: >-
          {% set levels = ["keine Belastung", "gering", "mäßig", "hoch", "sehr hoch"] %}
          {% set p = state_attr('sensor.pollen_raw_data', 'contamination') | selectattr('poll_title', 'search', 'Erle') | list | first %}
          {{ levels[p.contamination_1 | int] if p is defined else 'unavailable' }}
        attributes:
          raw_value: >-
            {% set p = state_attr('sensor.pollen_raw_data', 'contamination') | selectattr('poll_title', 'search', 'Erle') | list | first %}
            {{ p.contamination_1 if p is defined else 'unknown' }}
          title: "Erle"

      - name: "Pollen Hasel"
        state: >-
          {% set levels = ["keine Belastung", "gering", "mäßig", "hoch", "sehr hoch"] %}
          {% set p = state_attr('sensor.pollen_raw_data', 'contamination') | selectattr('poll_title', 'search', 'Hasel') | list | first %}
          {{ levels[p.contamination_1 | int] if p is defined else 'unavailable' }}
        attributes:
          raw_value: >-
            {% set p = state_attr('sensor.pollen_raw_data', 'contamination') | selectattr('poll_title', 'search', 'Hasel') | list | first %}
            {{ p.contamination_1 if p is defined else 'unknown' }}
          title: "Hasel"

      - name: "Pollen Platane"
        state: >-
          {% set levels = ["keine Belastung", "gering", "mäßig", "hoch", "sehr hoch"] %}
          {% set p = state_attr('sensor.pollen_raw_data', 'contamination') | selectattr('poll_title', 'search', 'Platane') | list | first %}
          {{ levels[p.contamination_1 | int] if p is defined else 'unavailable' }}
        attributes:
          raw_value: >-
            {% set p = state_attr('sensor.pollen_raw_data', 'contamination') | selectattr('poll_title', 'search', 'Platane') | list | first %}
            {{ p.contamination_1 if p is defined else 'unknown' }}
          title: "Platane"

      - name: "Pollen Gräser"
        state: >-
          {% set levels = ["keine Belastung", "gering", "mäßig", "hoch", "sehr hoch"] %}
          {% set p = state_attr('sensor.pollen_raw_data', 'contamination') | selectattr('poll_title', 'search', 'Grä') | list | first %}
          {{ levels[p.contamination_1 | int] if p is defined else 'unavailable' }}
        attributes:
          raw_value: >-
            {% set p = state_attr('sensor.pollen_raw_data', 'contamination') | selectattr('poll_title', 'search', 'Grä') | list | first %}
            {{ p.contamination_1 if p is defined else 'unknown' }}
          title: "Gräser"

      - name: "Pollen Roggen"
        state: >-
          {% set levels = ["keine Belastung", "gering", "mäßig", "hoch", "sehr hoch"] %}
          {% set p = state_attr('sensor.pollen_raw_data', 'contamination') | selectattr('poll_title', 'search', 'Roggen') | list | first %}
          {{ levels[p.contamination_1 | int] if p is defined else 'unavailable' }}
        attributes:
          raw_value: >-
            {% set p = state_attr('sensor.pollen_raw_data', 'contamination') | selectattr('poll_title', 'search', 'Roggen') | list | first %}
            {{ p.contamination_1 if p is defined else 'unknown' }}
          title: "Roggen"

      - name: "Pollen Urticaceae"
        state: >-
          {% set levels = ["keine Belastung", "gering", "mäßig", "hoch", "sehr hoch"] %}
          {% set p = state_attr('sensor.pollen_raw_data', 'contamination') | selectattr('poll_title', 'search', 'Urticaceae') | list | first %}
          {{ levels[p.contamination_1 | int] if p is defined else 'unavailable' }}
        attributes:
          raw_value: >-
            {% set p = state_attr('sensor.pollen_raw_data', 'contamination') | selectattr('poll_title', 'search', 'Urticaceae') | list | first %}
            {{ p.contamination_1 if p is defined else 'unknown' }}
          title: "Nessel- und Glaskraut"

      - name: "Pollen Ölbaum"
        state: >-
          {% set levels = ["keine Belastung", "gering", "mäßig", "hoch", "sehr hoch"] %}
          {% set p = state_attr('sensor.pollen_raw_data', 'contamination') | selectattr('poll_title', 'search', 'Ölbaum') | list | first %}
          {{ levels[p.contamination_1 | int] if p is defined else 'unavailable' }}
        attributes:
          raw_value: >-
            {% set p = state_attr('sensor.pollen_raw_data', 'contamination') | selectattr('poll_title', 'search', 'Ölbaum') | list | first %}
            {{ p.contamination_1 if p is defined else 'unknown' }}
          title: "Ölbaum"

      - name: "Pollen Beifuß"
        state: >-
          {% set levels = ["keine Belastung", "gering", "mäßig", "hoch", "sehr hoch"] %}
          {% set p = state_attr('sensor.pollen_raw_data', 'contamination') | selectattr('poll_title', 'search', 'Beifu') | list | first %}
          {{ levels[p.contamination_1 | int] if p is defined else 'unavailable' }}
        attributes:
          raw_value: >-
            {% set p = state_attr('sensor.pollen_raw_data', 'contamination') | selectattr('poll_title', 'search', 'Beifu') | list | first %}
            {{ p.contamination_1 if p is defined else 'unknown' }}
          title: "Beifuß"

      - name: "Pollen Ragweed"
        state: >-
          {% set levels = ["keine Belastung", "gering", "mäßig", "hoch", "sehr hoch"] %}
          {% set p = state_attr('sensor.pollen_raw_data', 'contamination') | selectattr('poll_title', 'search', 'Ragweed') | list | first %}
          {{ levels[p.contamination_1 | int] if p is defined else 'unavailable' }}
        attributes:
          raw_value: >-
            {% set p = state_attr('sensor.pollen_raw_data', 'contamination') | selectattr('poll_title', 'search', 'Ragweed') | list | first %}
            {{ p.contamination_1 if p is defined else 'unknown' }}
          title: "Ragweed"

      - name: "Pollen Pilzsporen"
        state: >-
          {% set levels = ["keine Belastung", "gering", "mäßig", "hoch", "sehr hoch"] %}
          {% set p = state_attr('sensor.pollen_raw_data', 'contamination') | selectattr('poll_title', 'search', 'Pilzsporen') | list | first %}
          {{ levels[p.contamination_1 | int] if p is defined else 'unavailable' }}
        attributes:
          raw_value: >-
            {% set p = state_attr('sensor.pollen_raw_data', 'contamination') | selectattr('poll_title', 'search', 'Pilzsporen') | list | first %}
            {{ p.contamination_1 if p is defined else 'unknown' }}
          title: "Pilzsporen"
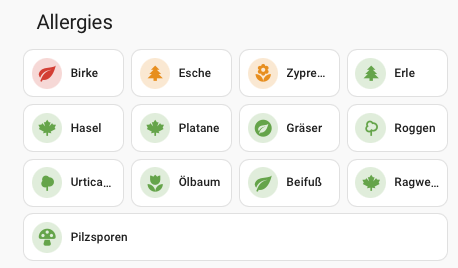
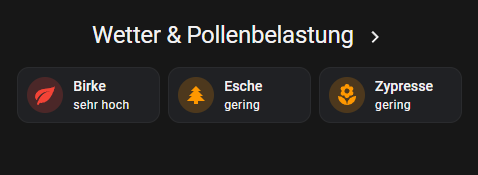
Wich creates me Sensors  for the Lovelace I use following code
type: vertical-stack
cards:
  - type: horizontal-stack
    cards:
      - type: custom:mushroom-template-card
        entity: sensor.pollen_birke
        primary: Birke
        icon: mdi:leaf
        icon_color: >
          {% set state = states('sensor.pollen_birke') %} {% if state == 'sehr
          hoch' %}
            red
          {% elif state == 'hoch' %}
            deep-orange
          {% elif state == 'mäßig' %}
            amber
          {% elif state == 'gering' %}
            orange
          {% else %}
            green
          {% endif %}
      - type: custom:mushroom-template-card
        entity: sensor.pollen_esche
        primary: Esche
        icon: mdi:pine-tree
        icon_color: >
          {% set state = states('sensor.pollen_esche') %} {% if state == 'sehr
          hoch' %}
            red
          {% elif state == 'hoch' %}
            deep-orange
          {% elif state == 'mäßig' %}
            amber
          {% elif state == 'gering' %}
            orange
          {% else %}
            green
          {% endif %}
      - type: custom:mushroom-template-card
        entity: sensor.pollen_zypressen
        primary: Zypressen
        icon: mdi:flower
        icon_color: >
          {% set state = states('sensor.pollen_zypressen') %} {% if state ==
          'sehr hoch' %}
            red
          {% elif state == 'hoch' %}
            deep-orange
          {% elif state == 'mäßig' %}
            amber
          {% elif state == 'gering' %}
            orange
          {% else %}
            green
          {% endif %}
      - type: custom:mushroom-template-card
        entity: sensor.pollen_erle
        primary: Erle
        icon: mdi:pine-tree
        icon_color: >
          {% set state = states('sensor.pollen_erle') %} {% if state == 'sehr
          hoch' %}
            red
          {% elif state == 'hoch' %}
            deep-orange
          {% elif state == 'mäßig' %}
            amber
          {% elif state == 'gering' %}
            orange
          {% else %}
            green
          {% endif %}
  - type: horizontal-stack
    cards:
      - type: custom:mushroom-template-card
        entity: sensor.pollen_hasel
        primary: Hasel
        icon: mdi:leaf-maple
        icon_color: >
          {% set state = states('sensor.pollen_hasel') %} {% if state == 'sehr
          hoch' %}
            red
          {% elif state == 'hoch' %}
            deep-orange
          {% elif state == 'mäßig' %}
            amber
          {% elif state == 'gering' %}
            orange
          {% else %}
            green
          {% endif %}
      - type: custom:mushroom-template-card
        entity: sensor.pollen_platane
        primary: Platane
        icon: mdi:leaf-maple
        icon_color: >
          {% set state = states('sensor.pollen_platane') %} {% if state == 'sehr
          hoch' %}
            red
          {% elif state == 'hoch' %}
            deep-orange
          {% elif state == 'mäßig' %}
            amber
          {% elif state == 'gering' %}
            orange
          {% else %}
            green
          {% endif %}
      - type: custom:mushroom-template-card
        entity: sensor.pollen_graeser
        primary: Gräser
        icon: mdi:leaf-circle
        icon_color: >
          {% set state = states('sensor.pollen_graeser') %} {% if state == 'sehr
          hoch' %}
            red
          {% elif state == 'hoch' %}
            deep-orange
          {% elif state == 'mäßig' %}
            amber
          {% elif state == 'gering' %}
            orange
          {% else %}
            green
          {% endif %}
      - type: custom:mushroom-template-card
        entity: sensor.pollen_roggen
        primary: Roggen
        icon: mdi:tree-outline
        icon_color: >
          {% set state = states('sensor.pollen_roggen') %} {% if state == 'sehr
          hoch' %}
            red
          {% elif state == 'hoch' %}
            deep-orange
          {% elif state == 'mäßig' %}
            amber
          {% elif state == 'gering' %}
            orange
          {% else %}
            green
          {% endif %}
  - type: horizontal-stack
    cards:
      - type: custom:mushroom-template-card
        entity: sensor.pollen_urticaceae
        primary: Urticaceae
        icon: mdi:tree
        icon_color: >
          {% set state = states('sensor.pollen_urticaceae') %} {% if state ==
          'sehr hoch' %}
            red
          {% elif state == 'hoch' %}
            deep-orange
          {% elif state == 'mäßig' %}
            amber
          {% elif state == 'gering' %}
            orange
          {% else %}
            green
          {% endif %}
      - type: custom:mushroom-template-card
        entity: sensor.pollen_oelbaum
        primary: Ölbaum
        icon: mdi:flower-tulip
        icon_color: >
          {% set state = states('sensor.pollen_oelbaum') %} {% if state == 'sehr
          hoch' %}
            red
          {% elif state == 'hoch' %}
            deep-orange
          {% elif state == 'mäßig' %}
            amber
          {% elif state == 'gering' %}
            orange
          {% else %}
            green
          {% endif %}
      - type: custom:mushroom-template-card
        entity: sensor.pollen_beifuss
        primary: Beifuß
        icon: mdi:leaf
        icon_color: >
          {% set state = states('sensor.pollen_beifuss') %} {% if state == 'sehr
          hoch' %}
            red
          {% elif state == 'hoch' %}
            deep-orange
          {% elif state == 'mäßig' %}
            amber
          {% elif state == 'gering' %}
            orange
          {% else %}
            green
          {% endif %}
      - type: custom:mushroom-template-card
        entity: sensor.pollen_ragweed
        primary: Ragweed
        icon: mdi:leaf-maple
        icon_color: >
          {% set state = states('sensor.pollen_ragweed') %} {% if state == 'sehr
          hoch' %}
            red
          {% elif state == 'hoch' %}
            deep-orange
          {% elif state == 'mäßig' %}
            amber
          {% elif state == 'gering' %}
            orange
          {% else %}
            green
          {% endif %}
  - type: horizontal-stack
    cards:
      - type: custom:mushroom-template-card
        entity: sensor.pollen_pilzsporen
        primary: Pilzsporen
        icon: mdi:mushroom
        icon_color: >
          {% set state = states('sensor.pollen_pilzsporen') %} {% if state ==
          'sehr hoch' %}
            red
          {% elif state == 'hoch' %}
            deep-orange
          {% elif state == 'mäßig' %}
            amber
          {% elif state == 'gering' %}
            orange
          {% else %}
            green
          {% endif %}
title: Allergies