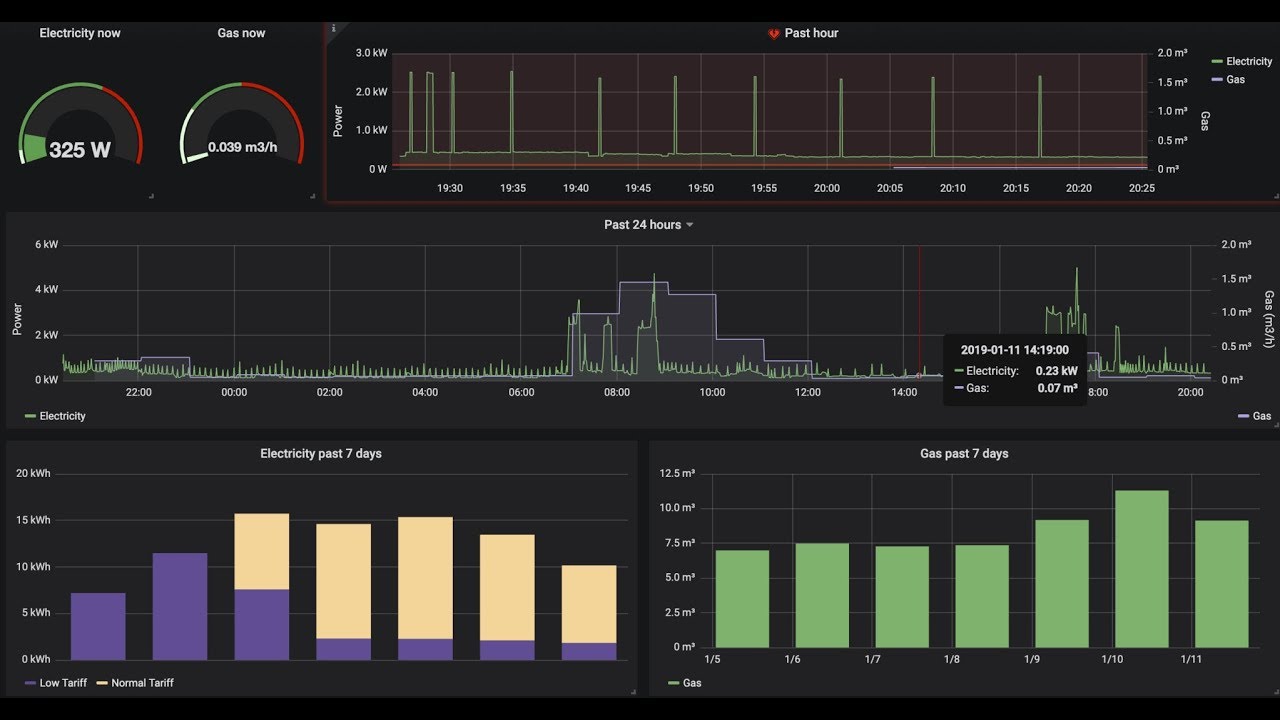
Hi, someone managed to have monthly bars view (one bar for each month). I use above method for day and week bars but it seems tha it don’t properly work for month bars…
Try using the relative time now-1M
Hello everyone,
I have been thinking on what could be the visuals to implement for people having only the power meter consumption in kWh as an information. In my case, I have installed a photoresistor on the power meter LED so that I increment the power consumption in Wh at every blink.
What do you think about?
Any clue on how to do that in Grafana?
I don’t have access to my setup right now but it’s based on this article here and the corresponding export on gitlab. I mainly just took out the stats for gas and modified the existing ones a little.
Just a quick check; in my case I have solar panels that are producing some power. During day time that means that my power consumption in general is negative (e.g. the solar panel production is higher than my consumption). The display on my smart meter indeed indicates a negative value for consumption. In Hassio however the ’ [sensor.power_consumption]’ is 0 (zero) and so are the consumption for tarif 1 and tarif 2.
Obviously I’m consuming some energy (e.g. the fridge) so I still want to be able to measure this. I do see my [sensor.power_production] dropping in value once a device (e.g. microwave) is active so I might be able to use this to derive the power consumed if I would know actual power provided by the solar panels (e.g. not the power delivered back to the net).
Any ideas?
Depends on the setup you have and what is connected to home assitant? If i understand correct youre solar panels are not connected and only the power meter is connected? Depending on the meter and how this is connected you can also have a sensor for power consumption and for production:
Take your power_production and add the negative value from your meter, that should get you how much you home is using.
Solar + Meter = House Usage
Example: 6513W + -3218W = 3295W
@dutchdevil83, yes that is correct. At this moment I only have the power meter connected to Home Assistant. I did see that Solax is supported in HA so I might integrate the solar panels in the future.
@firstof9, that’s indeed the plan. However my negative power consumption is not being read by Home Assistant. Can it be that the DSMR integration does not support negative values? As you can see the power consumption is 0.0 in HA whilst the smart meter indicates -3.3 kW.
Sounds like a bug, I’d report it on github.
Might be a bit late to respond but I noticed this whilst looking to set some smart plugs up.
net_consumption

(boolean)(Optional)

Set this to True if you would like to treat the source as a net meter. This will allow your counter to go both positive and negative.
I need to get the info to influxdb. My influxdb addon is installed inside HA. How can i do that so that i can see this database in Grafana?
I am using de dsmr not the dsmr reader. Do i also need the utility meter addon?


