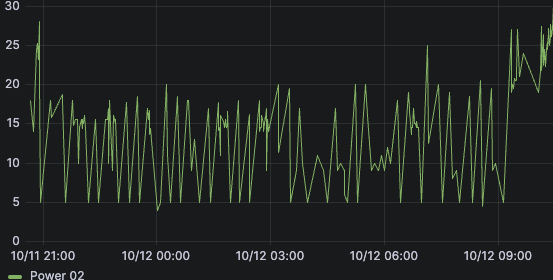
Send metrics to InfluxDB at regular intervals

HA has almost 2000 different integrations in core alone, not including all the many many custom ones in HACS and other places. How could it possibly know when a sensor has stopped working? The answer to that question varies wildly across those integrations. Some sensors check in so frequently that a second without an update is an issue. Some only change every other month and are totally fine in between.

Integration authors have a mechanism for specifying that there is a problem in the sensors created by that integration, they change its state to unavailable or unknown. The problem is we can’t actually report that state to Influx. Influx expects things to have a consistent schema. So if you have a sensor with a numeric state then it expects to keep receiving a numeric value for the state of that sensor. If it gets handed the string unknown or unavailable as the state instead it has issues.

I would also question why Influx would need to know that. HA is an automation platform. It has all the sensors, it knows when they are unavailable or unknown and you can build an automation to react to that information which does whatever you want. Or if a particular integration you use doesn’t have the capability to set a sensor to unknown or unavailable you can build a time-based check-in automation that takes an action when a sensor hasn’t had a state change in too long. Why does it matter if Influx knows this information? What do you want to do with that information that HA can’t?

As for the “re-report state every x minutes”, there have been several issues and at least one PR about it and they were rejected. HA tracks state changes as its integrations tell them state has changed and acts on that information. The InfluxDB integration allows you to report those state change events out to another system (in this case Influx). Inventing fake state change events to fill gaps in InfluxDB functionality isn’t where this integration wants to be. And in my opinion wouldn’t even solve the problem? If you re-reported state changes every hour for instance you could still be hit with the fill() issue if you picked any time range below an hour, where you found no data points and therefore had nothing to fill. You’d have to speed up the re-reporting to every couple minutes and now you start to have a performance problem since the integration is doing so much work re-reporting that nothing has changed.

Kapacitor has the capability to write TICKscripts which run on Influx’s side and can do a lot of things. If you do want to do these things you can fill in both of these gaps on Influx’s side using TICKscripts. Robbie1221 shared a solution for doing so here

This is the reason for example ESPHome schedules on its end the sensor data to be committed to home assistant and home assistant forwards it to influxDB. And ESPHome has keepalive.(I can not speak for other integrations but if they do not have a keepalive feature they are just poor ones and if low energy is required then one makes the keepalive infrequent) In monitoring no data is also considered data hence the NOP/keepalive specs in most monitoring standards.

Thanks for this great reply.

I agree with your point that making every source repeat the same data over and over again to detect when something stops working would be very inefficient.

Why does it matter if Influx knows this information? What do you want to do with that information that HA can’t?

I am logging data and looking at graphs in Grafana. I am using WiFi and BLE thermometers. The temperature and humidity values are sent via MQTT messages, pushed as a sensor into HA and then pushed to InfluxDB via the InfluxDB integration.
When one sensor stops working (out of range, out of battery), I would like to see a hole in the data instead of old data that is not valid anymore.
This matters because averages, zoomed out graphs, etc become incorrect when Grafana incorrectly fills gap with the last value.
And if I do not make Grafana fill gaps then I have lots of gaps when the data is not changing.

Up until a few weeks ago, I was pushing the data directly from mqtt to influxdb (with telegraf) and with the right min_interval setting I get the behavior I want: there is a gap when the sensor did not send data in the interval - or there is a value. This is the behavior that I would like to reproduce but using HA to manage all my sensors no matter where the data comes from (MQTT, Zigbee, etc).

From your reply, I understand that I actually have two problems:

  • I need a way to configure MQTT so that my mqtt temperature sensors go into the unknown state when they have not sent an update for more than X seconds. I am probably not the first one to look for this.
  • I need a way to report “unavailable” to InfluxDB. But as you explained there is no good solution for this in influxdb. I think the key insight here is that InfluxDB might not be the right solution for what I am trying to do here.

Thanks for sharing Robbie’s solutions. But what he is doing is basically just pushing the data once via HA and once directly to InfluxDB. That would solve my problem indeed but then I am losing the advantage of having HA as the central hub through which everything flows and is normalized (and named) in the same way.

Hey. I am also bitten by this too and it makes some of the stored data really hard to visualize or query “reasonably”.

I wanted to analyze if my gas boiler is short cycling, it does e.g. this:

time[min],modulation[%]
0,0
1,0  # this is not sent to influx
2,30
3,10
4,10  # this is not sent to influx
5,10  # this is not sent to influx
6,0
7,0  # this is not sent to influx
...
98,0  # this is not sent to influx
99,10

and that makes it almost impossible to graph nicely without manually handling the data. This is how it should look like:

but in influx the closest you can get by playing with fill and aggregations:


this is how the first peak looks like in raw data:

2 Likes

I had the same problem. But using ESPHome sensors You can add line in config:

force_update: true

like this:

  - platform: xiaomi_lywsd03mmc
    mac_address: a4:c1:38:xx:xx:xx
    bindkey: "5ce70db8a16c51eff4933256ed127c14"
    temperature:
      name: "bedroom Temperature"
      force_update: true
    humidity:
      name: "bedroom Humidity"
      force_update: true
    battery_level:
      name: "bedroom Battery Level"  

And it helps.
Or You can add false accuracy with this line:

accuracy_decimals: 3

sensor will report its noise this way.

Both of those approaches will make the ESP board use more power. Mine is connected to the wall so no problem there.
The sensors use the same amount of power.

edit:
I also found command heartbeat here that can do the same but i didn’t test it yet

1 Like

You can define a template sensor and add a fake attribute which changes regularly, e.g. every minute. HA will send the state on attribute changes. The fake attribute can be filtered by ignore_attributes in the InfluxDB integration config if needed. For me it works perfectly.

Any news on this? Seems like the proper solution would be a new Configuration Parameter in the core InfluxDB integration to force and update to InfluxDB at a configured interval, even if there has not been a state change.

Most workarounds out there are difficult to integrate or only apply to one device at a time, not making theses a viable solution if multiple different devices are sending the data to Influx.

1 Like

I came to the same conclusion as this thread and the mentioned PR independently, so I think that helps validate the idea of sending the data periodically.

This is true with anything in InfluxDB, but in practice it’s not normally an issue. For example, collectd will usually run every 10 seconds, and report unchanging values like disk usage or zeros on network interfaces. Needing to zoom in closer than that is rare, and the report interval can be tuned as needed. With the current HA integration, I can be looking at a week or month-long range and still be missing many entities in a query.

I wonder if just the periodic updates could be written as a custom integration, without having to fork the core influxdb integration? Then we could eventually compare the number of installs to the number of installs of just influxdb, and if it reaches a certain amount re-propose including in core.

1 Like

This would be a great way to add this missing feature without impact to the normal influxdb integration. Is it so hard to implement sending data in regular intervals or what is the reason why this has not been integrated yet? It is a must have when a sensor or binary sensor doesn’t change very often. A time series database is built for values that do not change very often - so it will not have impact on database size it the values are saved more often without value changes. I need this feature, too :slight_smile:

Repeating measurements at regular intervals seems to me to be the wrong approach.

I have irregular sensors, I’d like those measurements to go into influxdb as and when they come in.

Repeating the last value at regular intervals just hides problems, if I have a (battery) temperature sensor reporting a steady 20 degrees at 10 am, 11 am and 12.27pm, at 6 pm my last value is 20 degrees and from the influxdb end there’s no way to tell if it’s still actually 20 degrees or whether the thing failed or fell off the zigbee net at 1 pm.

I am a bit at a loss to understand what would be the benefit to send metrics in InfluxDB in regular intervals.

In the screenshot, you can see a Grafana dashboard with (a) data from my Prometheus DB, which scrapes Home-Assistant every minute, vs InfluxDB db (b), where points are only drawn at the correct measurement points of the sensors.

I see no benefit in the graph above, it just shows the data wrongly, in my opinion.
Temperature does not change by 0.5 degree in a second, after being constant for an hour.

But if you prefer the look from the Graph above, you can just use Prometheus for that.
My only reason for switching from Prometheus (which scrapes the metrics of all of my other apps) to InfluxDB is because normally you cannot push data to Prometheus. It just scrapes them at regular intervals.

But I still think, repeating the last measurement every minute until a new measurement arrives, is wrong, and looks wrong in the graphs too.

But maybe I am misunderstanding something?
I have no gaps in my data in Grafana, no matter the distance between two measurements.

Can I restate the problem slightly?

I have a physical sensor, which measures and reports values every so often. The Home Assistant integration for the sensor will only update its state object when the value changes, and the Home Assistant integration for InfluxDB will only send values when the state object is updated.

But what I want is for every physical measurement to be recorded in InfluxDB.

There is slight precedent for this within Home Assistant, as sensor state will go “unavailable” when the sensor is known to not be sending updates. If we reported this state change to InfluxDB as a null then fill(previous) would work in more cases. Unfortunately even the Prometheus integration saves and reports the last known value rather than letting prom see the state is unavailable.

The root of the problem within the HA ecosystem is the same as that in the day job: being able to tell the difference between “didn’t change” and “unknown”.

Hi,

I just found this post because I have the same problem.

I past the last week trying to understand why my sensors were loosing connection to find out that they were correctly sending data but HASS was just ignoring them.

This may be an expected feature, but it is very unintuitive for new users. I had to investigate this every night for an entire week to find that hidden mechanism.


That being said, there is one main reason I would appreciate this feature: I’m monitoring current drawn by some of my electronic devices. For this I use a Tuya TS011F power plug that report current, voltage and power every 15min if nothing change (i.e. when devices are off), and as often as possible when those data changes.

Problem is that a device can be shut down for many hours. And when this happens, only 1 state is pushed to the database: the first 0W report. Then no state is logged for many hours, until the device is turned on again (even if in reality the device sent “0W” many times per hour).

First impact is that for all those hours, I can’t see the difference between electric devices being off or if zigbee lost the connection with the power plug. The only way I found is to check Zigbee2Mqtt logs.

Also in this scenario, by default a grafana would output this:

The left slope (from 12h to 21h) is because no data is registered in that interval and grafana fill the gap (the slope starts at 12h because I rebooted HASS, but in a normal scenario it would have started at 01h)
The right slope (from 00h30 to 14h)is because the 0W point is lost by the default group and mean that is applied by grafana.

Those 10 hours long slopes should not appear because there where literally 0Wh consumed during those periods. So they provide false info.

I can remove the group and mean function to remove the right slope:

But the there is too much noise on the data and so the graph is harder to read. But anyway, it is better than nothing.

Then if I want to remove the left slope, I should play with the line interpolation and use step after

But here again, this make the graph harder to read. This is not obvious on that graph, but here is another before after that is more obvious:
image
image

If it was possible to disable this “don’t update twice the same value” rule, it would be possible for me to use any graph feature I want (mean, group, linear interpolation etc). Some of them would make the graph less precise, but it would be still acceptable compared to having the choice between precision and readability.

Also I forgot to mention that in my case HASS displays the same value for last updated and last changed. This was part of why I thought my devices were loosing connection with HASS
image

I have a variation on this problem. I am measuring my pool temperature. And it changes very slowly, so on my graphs I see similar to the following where only a small pip is present in a window where the temp changed.
Another one is car battery. It reaches charge limit and can sit there for some time before changing.

In my previous custom system before I took up HA I was writing sensor value every x seconds to the database and didn’t have this problem. Influx is a timeseries database and is designed for this kind of regular data frequency and it’s not as inefficient as you might imagine.

My guess is the HA plugin is connecting to domain events rather than individual sensors, so would need a bit of a re-work.

But that might not be the answer here, no doubt the sparse data approach is efficient.

What would be good is the solution suggested up the thread:

Get last value before current time window and prepend it to the data and have Grafana use it to backfill.
… or something like that.

Here looking for the same thing. I have a dashboard that lets me quickly see if a very important zwave switch is on. I use it primarily just to monitor the power usage, etc, but I want to know for sure it is on, because one time it got turned off accidentally and it was very bad. If my timerange in Grafana includes the last time it was changed to ON, then it looks good. If not, I get “???” because there is no data. Using fill, last or other Grafana tricks doesn’t help because there’s literally no data for the interval to fill with.

I understand it is designed to only send to InfluxDB on change, but SOME way to periodically send status updates to show the current state would solve this problem. I’d be happy specifying entity ids that this should happen to.

Last 24 Hours

Last 3 Hours

Create a template sensor with an attribute based on time
I stopped forwarding to Influx quite a while ago and only have a sample for a template sensor based on the old syntax ( which might still work, but is no longer recommended to use). Also I’m not 100% sure it is correctly formatted, but perhaps you get the idea

sensor:
  - platform: template
    sensors: 
      influx_sensor_db:
        value_template: "{{ states('sensor.the_sensor') }}"
        friendly_name: "Example Template Sensor"
        device_class: temperature
        attribute_templates:
          update_now: "{{ (now().minute / 5) | round(0) }}"

the attribute “update_now” updates every 5 minutes ( minute of current time between 0 and 59, divided by 5 and rounded to a full number) and forces to update the template even if the sensor this is based on ( the one in the value template) did not update. Send this entity to influx

1 Like

Thanks @armin-gh !!

Here’s what I ended up with, working nicely. :slight_smile:

binary_sensor:
  - platform: template
    sensors:
      influx_sensor_db:
        value_template: "{{ states('switch.smart_switch_6') }}"
        friendly_name: "Sump Power Status"
        device_class: POWER
        attribute_templates:
          update_now: "{{ (now().minute / 5) | round(0) }}"