I’m curious, has anyone figured out a way to get the alert area polygons in HA? I am interested in allowing for more accurate alerting, so a warning trigger only occurs if your location(s) are within the polygon. Implementing this based on physical home location and device tracker locations would be interesting. It would also be nice if the alert polygon was displayed on the map page along with all of your other location-based objects.
Do you know if the public API provides a way to do that? I’ve never seen it.
and even if so I’m not sure how it could be incorporated into the map.
According to weather.gov … maybe? https://www.weather.gov/media/documentation/docs/NWS_Geolocation.pdf
The first section shows the API response returning the geometry of the polygon in latitude/longitude. So one could do a trigger/condition based on if their lat/lon falls within this geometry.
2 Likes
Yup right there it is…I completely forgot it was in the raw data.
So in that case you could get the coordinates of every vertex of the polygon and build a sensor from there but depending on the complexity of the polygon it would be a math nightmare to calculate if your position is within the boundaries of the defined polygon
I just looked at a test alert and it had 7 defined vertices.
you might be able to put them all in a list and get the max and min values for both the lat and lon values and then create a simplified box to give you a general idea if you fall within that simplified box but it won’t necessarily be accurate depending on the complexity of the original polygon.
Add to that I’m not sure how you could automate setting the device tracker current location for the integration to get alerts for your moving location. You could change the alert zones manually tho as you travel (which is what I do when we travel)
but @Bryan_Fleming if you want to play with the data you can get the raw data by accessing the API for your location or a location that has an active alert.
I have an example in the github for pulling the raw API data but it’s generally:
https://api.weather.gov/alerts/active?zone=<YOUR_ZONE>
here is “quick, down & dirty” calculation that gives you the coordinates of the biggest rectangle that contains all points within the seven coordinates I looked at above.
there’s likely a better way to get the values but this works for anywhere in the western and northern quadrant of the globe (I think…)
it’s not pretty but it might get you started tho.
{% set value_json = {
    "@context": [
        "https://geojson.org/geojson-ld/geojson-context.jsonld",
        {
            "@version": "1.1",
            "wx": "https://api.weather.gov/ontology#",
            "@vocab": "https://api.weather.gov/ontology#"
        }
    ],
    "type": "FeatureCollection",
    "features": [
        {
            "id": "https://api.weather.gov/alerts/urn:oid:2.49.0.1.840.0.d0d7637a2a18ffaa2e1b40d360b251c5c1a52df9.002.1",
            "type": "Feature",
            "geometry": {
                "type": "Polygon",
                "coordinates": [
                    [
                        [
                            -92.230000000000004,
                            33.109999999999999
                        ],
                        [
                            -92.359999999999999,
                            33.229999900000003
                        ],
                        [
                            -92.609999999999999,
                            33.290000000000006
                        ],
                        [
                            -92.469999999999999,
                            33.38000000000001
                        ],
                        [
                            -92.260000000000005,
                            33.330000000000013
                        ],
                        [
                            -92.120000000000005,
                            33.220000000000013
                        ],
                        [
                            -92.230000000000004,
                            33.109999999999999
                        ]
                    ]
                ]
            },
            "properties": {
                "@id": "https://api.weather.gov/alerts/urn:oid:2.49.0.1.840.0.d0d7637a2a18ffaa2e1b40d360b251c5c1a52df9.002.1",
                "@type": "wx:Alert",
                "id": "urn:oid:2.49.0.1.840.0.d0d7637a2a18ffaa2e1b40d360b251c5c1a52df9.002.1",
                "areaDesc": "Bradley, AR; Calhoun, AR; Union, AR",
                "geocode": {
                    "SAME": [
                        "005011",
                        "005013",
                        "005139"
                    ],
                    "UGC": [
                        "ARC011",
                        "ARC013",
                        "ARC139"
                    ]
                },
                "affectedZones": [
                    "https://api.weather.gov/zones/county/ARC011",
                    "https://api.weather.gov/zones/county/ARC013",
                    "https://api.weather.gov/zones/county/ARC139"
                ],
                "references": [
                    {
                        "@id": "https://api.weather.gov/alerts/urn:oid:2.49.0.1.840.0.6408665bffc8280c98409bb0ed67ea326aa18bba.002.1",
                        "identifier": "urn:oid:2.49.0.1.840.0.6408665bffc8280c98409bb0ed67ea326aa18bba.002.1",
                        "sender": "[email protected]",
                        "sent": "2023-02-16T20:17:00-06:00"
                    },
                    {
                        "@id": "https://api.weather.gov/alerts/urn:oid:2.49.0.1.840.0.70f1cca3596fc52bf6bd0f913cb9aa023de468dd.002.1",
                        "identifier": "urn:oid:2.49.0.1.840.0.70f1cca3596fc52bf6bd0f913cb9aa023de468dd.002.1",
                        "sender": "[email protected]",
                        "sent": "2023-02-17T10:06:00-06:00"
                    }
                ],
                "sent": "2023-02-17T19:53:00-06:00",
                "effective": "2023-02-17T19:53:00-06:00",
                "onset": "2023-02-17T19:53:00-06:00",
                "expires": "2023-02-18T20:00:00-06:00",
                "ends": null,
                "status": "Actual",
                "messageType": "Update",
                "category": "Met",
                "severity": "Severe",
                "certainty": "Observed",
                "urgency": "Immediate",
                "event": "Flood Warning",
                "sender": "[email protected]",
                "senderName": "NWS Little Rock AR",
                "headline": "Flood Warning issued February 17 at 7:53PM CST by NWS Little Rock AR",
                "description": "* WHAT...Minor flooding is occurring and minor flooding is forecast.\n\n* WHERE...Ouachita River At Thatcher L&D.\n\n* WHEN...Until further notice.\n\n* IMPACTS...At 85.0 feet, There may be some County roads along the\nriver flooded, requiring lengthy detours. River is high and swift,\nboaters should be very cautious. Access to many oil and gas rigs\nwill be by boat only. Levee gates should be closed.\n\n* ADDITIONAL DETAILS...\n- At 6:30 PM CST Friday the stage was 85.2 feet.\n- Forecast...The river is expected to remain steady above flood\nstage near 85.3 feet.\n- Flood stage is 79.0 feet.",
                "instruction": null,
                "response": "Avoid",
                "parameters": {
                    "AWIPSidentifier": [
                        "FLSLZK"
                    ],
                    "WMOidentifier": [
                        "WGUS84 KLZK 180153"
                    ],
                    "NWSheadline": [
                        "FLOOD WARNING REMAINS IN EFFECT UNTIL FURTHER NOTICE"
                    ],
                    "BLOCKCHANNEL": [
                        "EAS",
                        "NWEM",
                        "CMAS"
                    ],
                    "EAS-ORG": [
                        "WXR"
                    ],
                    "VTEC": [
                        "/O.CON.KLZK.FL.W.0007.000000T0000Z-000000T0000Z/"
                    ],
                    "expiredReferences": [
                        "[email protected],urn:oid:2.49.0.1.840.0.ba700134310724e57ee2d9397471fa2452c43e8e.002.1,2023-02-16T09:41:00-06:00 [email protected],urn:oid:2.49.0.1.840.0.d8c62a3f2b29eb0282c703088d2cfca662ad9d6f.002.1,2023-02-15T19:28:00-06:00 [email protected],urn:oid:2.49.0.1.840.0.37cc15c7f0137626a10c6addef72bd4abc596fd0.002.1,2023-02-15T09:55:00-06:00 [email protected],urn:oid:2.49.0.1.840.0.48f7780ef458137fad37925cd209f5231319f218.002.1,2023-02-14T19:48:00-06:00 [email protected],urn:oid:2.49.0.1.840.0.df832a10a4dd0ff45cf6447850bd2d3cc3540746.001.1,2023-02-14T10:21:00-06:00 [email protected],urn:oid:2.49.0.1.840.0.0d2bdbb0ec0f64b145b8bdf4373273f435755879.002.1,2023-02-13T19:31:00-06:00 [email protected],urn:oid:2.49.0.1.840.0.428cccd084de5486bc2b3338dc03210ecf807fef.002.1,2023-02-13T08:42:00-06:00 [email protected],urn:oid:2.49.0.1.840.0.13d770c03458f64239302f53ee9e309bc6603ca3.002.1,2023-02-12T20:18:00-06:00 [email protected],urn:oid:2.49.0.1.840.0.0e60c245573fac0f82489cdfd81116b07f93f683.002.1,2023-02-12T08:31:00-06:00 [email protected],urn:oid:2.49.0.1.840.0.e31761e0187f85956f86d982d39fe2b32b67d9a3.002.1,2023-02-11T20:02:00-06:00 [email protected],urn:oid:2.49.0.1.840.0.274539bb18fb8bd4b4be76e247b57fe05f03be05.002.1,2023-02-11T10:10:00-06:00 [email protected],urn:oid:2.49.0.1.840.0.f7e1c08393738070ed17706cd08062429fa931cd.002.1,2023-02-10T20:13:00-06:00 [email protected],urn:oid:2.49.0.1.840.0.993142d07695622b609ba2d672746366b125f9fb.001.1,2023-02-10T09:46:00-06:00 [email protected],urn:oid:2.49.0.1.840.0.02bb3a18b7e78d6a65972b2c992a76c05bea536b.003.1,2023-02-09T21:11:00-06:00 [email protected],urn:oid:2.49.0.1.840.0.0426c8a4bb332490ac5d6ca9708f59ba9eef9ac3.003.1,2023-02-09T09:16:00-06:00 [email protected],urn:oid:2.49.0.1.840.0.ef1ce521bd7d5457e9b97fa9cfcd8edf384a4d16.001.1,2023-02-08T20:59:00-06:00 [email protected],urn:oid:2.49.0.1.840.0.5d533ae8b493f5ada7d705ab13343b92c72d7bfa.001.1,2023-02-08T10:41:00-06:00 [email protected],urn:oid:2.49.0.1.840.0.8a729ccf42b3068d6b2c3e83ba423dbf6e60141e.002.1,2023-02-07T20:15:00-06:00 [email protected],urn:oid:2.49.0.1.840.0.efe0849340c91eadfcc822bba0617f71998c3b93.002.1,2023-02-07T10:20:00-06:00 [email protected],urn:oid:2.49.0.1.840.0.1c9277319286d771b641518b20cd49fa7eba3174.002.1,2023-02-06T19:14:00-06:00 [email protected],urn:oid:2.49.0.1.840.0.bd1835aa36bedf1a385ee62b4a22b2a99b9d4e4e.005.1,2023-02-06T10:24:00-06:00 [email protected],urn:oid:2.49.0.1.840.0.fbfb4e049c8df6655e6a70ed80082b581e8f11d0.002.1,2023-02-05T19:06:00-06:00 [email protected],urn:oid:2.49.0.1.840.0.64825d6c61f6065d366efb84d8163436d7bb89f0.004.1,2023-02-05T10:00:00-06:00 [email protected],urn:oid:2.49.0.1.840.0.29b18fe6a08464454e99c1d2d373e25b89ebd9e8.002.1,2023-02-04T18:54:00-06:00 [email protected],urn:oid:2.49.0.1.840.0.3432d837720b4dabbeccbd3fb886de07d2365b3d.005.1,2023-02-04T10:15:00-06:00 [email protected],urn:oid:2.49.0.1.840.0.4f033dfd3dd11ef33ae02adf37c4206bda5e5ea9.002.1,2023-02-03T19:39:00-06:00 [email protected],urn:oid:2.49.0.1.840.0.0cbafba69c2815784e4584ed60d02e8529d5d652.002.1,2023-02-03T10:54:00-06:00 [email protected],urn:oid:2.49.0.1.840.0.7d91eeb0d113868e3e70232adf848c7bebc072a1.002.1,2023-02-02T19:27:00-06:00 [email protected],urn:oid:2.49.0.1.840.0.b8f88e1637601783277912c72b56a3968c37301c.002.1,2023-02-02T10:21:00-06:00 [email protected],urn:oid:2.49.0.1.840.0.3242e52709b72537c012652fd31bf35f04d6c0cc.002.1,2023-02-01T18:42:00-06:00 [email protected],urn:oid:2.49.0.1.840.0.d7c86b096924e754ae65dad3aa852af0495b75d1.002.1,2023-02-01T10:37:00-06:00 [email protected],urn:oid:2.49.0.1.840.0.b767065d0994bf37bed0fa212a1e3ba3587baeac.002.1,2023-01-31T21:06:00-06:00 [email protected],urn:oid:2.49.0.1.840.0.79f09b4cdad685fedeecaaab00e8326ec9ba14bb.001.1,2023-01-31T09:58:00-06:00 [email protected],urn:oid:2.49.0.1.840.0.21bbb43a15039f5497d150c38c0dce46fe432824.001.1,2023-01-30T18:36:00-06:00 [email protected],urn:oid:2.49.0.1.840.0.903d42c1d2e58528b29f9da5494281be199284d8.001.1,2023-01-30T09:46:00-06:00 [email protected],urn:oid:2.49.0.1.840.0.fc5c7c83ef415c690156226131149a276334a673.003.1,2023-01-29T19:43:00-06:00 [email protected],urn:oid:2.49.0.1.840.0.69afca5bff9ed317aedf2dc47722585bc8276b71.001.1,2023-01-29T10:33:00-06:00 [email protected],urn:oid:2.49.0.1.840.0.ea9d9b0bc94c69fd48c2c28638e6ef9b15417ff0.001.1,2023-01-28T19:31:00-06:00 [email protected],urn:oid:2.49.0.1.840.0.b4b31fc28b6c637d3fa52289cec99f1f09807bef.001.1,2023-01-28T10:48:00-06:00 [email protected],urn:oid:2.49.0.1.840.0.e198b8f375f8d8cb4627f9420f0cb4fd90ad411f.001.1,2023-01-27T19:56:00-06:00 [email protected],urn:oid:2.49.0.1.840.0.9417b1ee9b56465964c440cceea0ef171c94ab11.001.1,2023-01-27T10:35:00-06:00 [email protected],urn:oid:2.49.0.1.840.0.8dc03dd3144476844337a367e894a8b576a76b54.001.1,2023-01-27T10:27:00-06:00"
                    ]
                }
            }
        }
    ],
    "title": "Current watches, warnings, and advisories for Bradley County (ARC011) AR",
    "updated": "2023-02-18T02:30:00+00:00"
}
%}

{{ value_json.features[0].geometry.coordinates[0] | length }}

{% set coords = value_json.features[0].geometry.coordinates[0] %}

{{coords}}

{% set items = coords | length %}
{% set ns = namespace(max_lat=90) %}
{% for i in range(items) %}
  {% set  val = coords[i][1] %}
  {% set ns.max_lat = val if val < ns.max_lat else ns.max_lat %}
{% endfor %}
{% set max_lat = ns.max_lat %}

{% set ns = namespace(min_lat=0) %}
{% for i in range(items) %}
  {% set  val = coords[i][1] %}
  {% set ns.min_lat = val if val > ns.min_lat else ns.min_lat %}
{% endfor %}

{% set min_lat = ns.min_lat %}

{% set ns = namespace(max_lon=-180) %}
{% for i in range(items) %}
  {% set  val = coords[i][0] %}
  {% set ns.max_lon = val if val > ns.max_lon else ns.max_lon %}
{% endfor %}
{% set max_lon = ns.max_lon %}

{% set ns = namespace(min_lon=0) %}
{% for i in range(items) %}
  {% set  val = coords[i][0] %}
  {% set ns.min_lon = val if val < ns.min_lon else ns.min_lon %}
{% endfor %}

{% set min_lon = ns.min_lon %}

{{max_lon, max_lat}}
{{max_lon, min_lat}}
{{min_lon, max_lat}}
{{min_lon, min_lat}}
1 Like
Thanks @finity & @squirtbrnr-
There is also the ability to check for alerts at your specific latitude/longitude using the NWS API, from NWS_Geolocation.pdf:
If you wish to only receive active alerts for a specific point (for example, your house) regardless how the products are generated, you can request that via the point parameter:
https://api.weather.gov/alerts/active?point=38.9807,-76.9373
or for all alerts
https://api.weather.gov/alerts?point=38.9807,-76.9373
So, it seems it might be easy to poll the coordinates of your home for active alerts.
For the more developed integration that checks multiple points, the shapely library might do the trick: Run Fast Point-in-Polygon Tests. I’ve been playing around with this a bit tonight, but I’m afraid I’m a little bit over my head.
But that’s what the integration is doing but by using your NWS zone instead of your coordinates.
I don’t think there should be any differences between the two returned alerts results.
I originally started going down this rabbit hole because of a couple of severe weather events last year where the warning area included my zone. However, I was not actually within the warning polygon itself. I was hoping that by using the polygon (or the point query), I could refine the alert to be more accurate. For my geography, it seems there are often tornado warnings that form on the edge of the zone that ultimately does not pose a significant risk to my precise location.
Here’s an example of Colorado zones:
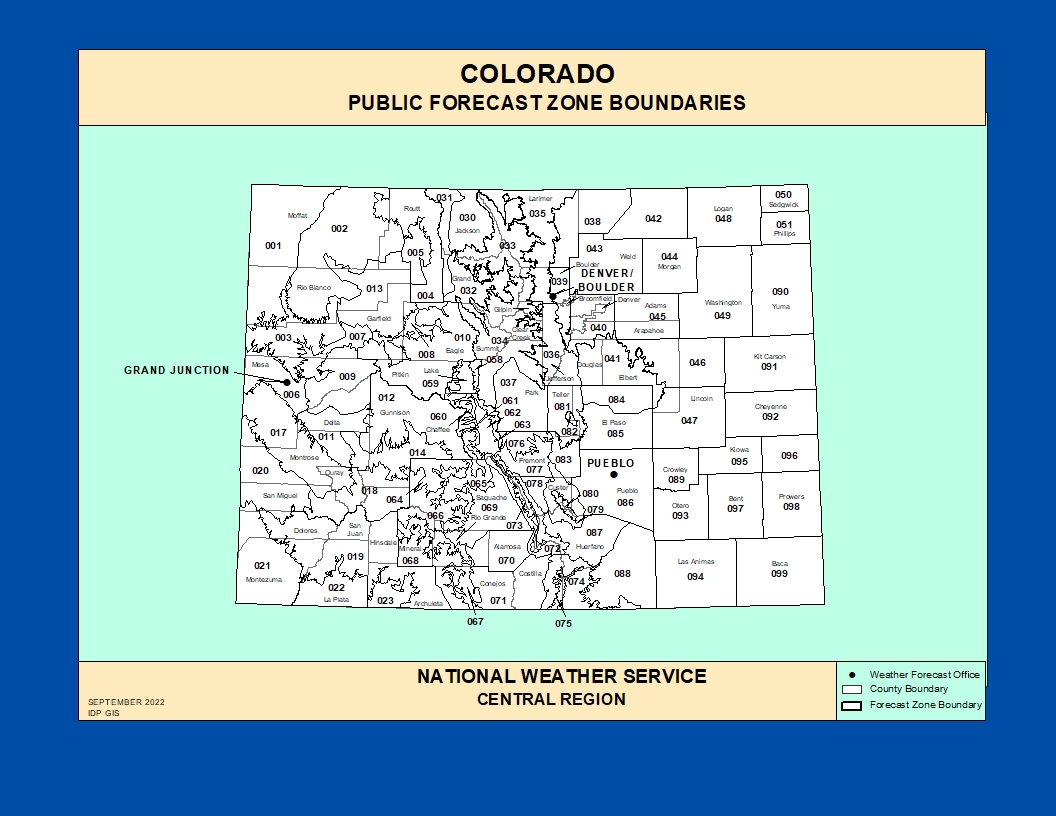
Most zones are relatively large, with warning polygons commonly occupying only a small area of the zone; this is especially true with severe thunderstorms and tornado warnings.
If you are open to a suggestion, it would be handy to have the ability to add point locations to the integration as well. I could foresee using both options, zones for a broader view of alerts and a point for a focused view of only those impacting my home. Thanks for considering! I genuinely appreciate your work on this integration.
I am but I think that might be more trouble than it’s worth. If it was the other way around where the alert wasn’t issued for you but should have been I would be more worried about it.
I’m not sure how I could set that up thru the UI to choose which method (zone or point) that the user wants to use.
I’m not really a programmer so that is probably beyond my abilities.
TBH, I’m not even the one who set up the UI config option. It was just a yaml only config in the beginning until firstof9 added that ability.
No problem. Thank you.
The problem with all of this is not the programming. It’s actually the system the NWS sets up and uses. They have two different alert systems. One is County/area based (FIPS regions). The other one which is newer is polygon based but more accurate to the tracking of a storm. The polygon is newer (2007-ish) and is slightly more accurate to the storm path. However there is still a flaw in the polygon system where if a storm track differently than where the polygon was issued, they cannot modify the polygon, they can only issue a new alert with a new area polygon with a new date/time, etc. This is why if you watch the radar with a polygon overlay you will see polygons disappear and reappear with the same eastward progression shape, but a modified westerly barrier. So what you end up with is repeated alerts because they are all treated as new alerts. But if you stick with the FIPS code, those alerts do not get reissued, just updated which the NWS integration handles and does not trigger a new alert to be broadcast (even though the update is officially broadcast over weather radio, etc).
1 Like
@squirtbrnr - Thanks for that background. I see how that makes things more difficult. I wonder if there would be a way to pair the two methods together for more accurate results, using the zone as the primary trigger and having a second step condition to check if that same alert polygon is over your location. I’ve just had a lot of headaches with the FIPS region since I am on the western side of many severe storms that spin up east of me and head away from my location.
@finity - If it’s okay, I’ll open an issue on the repo as an enhancement request; maybe someone will come up with an idea for implementing this.
Again, I appreciate the discussion; I wish I could work on a solution. Unfortunately, my program skills do not go much beyond the hello world level.
Hi everyone I am a dull tool in the shed when it comes to programming. I am so glad to have found this place since living in Tx we are getting many severe storms. Thanks to @finity and @eracknaphobia for working on this on your own time, I wish I had your skills. I’m hoping someone can help clarify how to actually setup the custom sensor package. Setting up the automation appears straight forward and I’ve changed things to represent my environment.
Do I put ‘TXC121,TXC085’ in the file called: nws_alerts.py where ? I’ve never setup a custom component and use python, so although when reading it, it sounds straight forward, but when I think about it, it goes blurry!!!
  DEFAULT_NAME = 'NWS Alerts'
  CONF_ZONE_ID = 'zone_id'
  ZONE_ID = ''
Am I on the right track ?
Additionally, when I create the script, can I jut copy past the code in the “YAML” called script which is called out in the config file or do I need to create a new YAML with the name of the script being called by the service: service: script.nws_popup_on_wx_alert
Thank you all for taking the time to make such a great tool for this environment!!!
No you don’t modify any of the files contained in the nws_alerts folder at all.
How did you install the integration? via HACS or by manually copying the folder from github?
I’m just wondering because if you’ve modified any of those files you should probably re-download the integration files and by using HACS it’s easier but either way is fine.
After you have clean new files (or if you haven’t modified them in the first place) then at that point you have two methods of configuring the integration. You can use the UI or manually via yaml.
to install via the UI then just go to the settings->devices&services page under the integrations tab and in the bottom right corner click on “add integration”. the search for NWS Alerts. Click on it then add the required data (it should already be filled in for the default options) and the click “submit”.
after that completes then you should have a new sensor in your dev tools->states list called “sensor.nws_alerts”.
once you are done with that if you still have questions feel free to post back again.
I don’t mind you putting in a request but I honestly don’t think anyone will see it besides me and possibly firstof9. So don’t put too much hope into it getting implemented.
@finity, thank you so much for taking the time to help. It really blows my mind that you spend so much time being a very good agent of help to so many of us on her. You are truly what make this community shine and continue to go.
I’ll go back based on your recommendations and start from there. I did a manual install where I pulled the files from the Git and copied them to my config.
Thanks
1 Like
Feel free to tag me man, I’m not a prude 
I don’t see a very elegant way to utilize the polygons myself, I mean if the weather’s getting tornado-y I’d rather be safe than sorry.
3 Likes
Yeah I know, but you know how some people on here get about it. even if it’s not them that’s being tagged. I can’t afford to run afoul of the “rules”.
Yup. For sure.
1 Like
It still won’t be too hard. just delete the current nws_alerts folder and copy it back in.
Ah ![]() I get ya, no worries.
I get ya, no worries.
@finity - I just followed your instructions and I think it worked. I went to the integrations page and was able to find the nws alert integration, which is now on my UI.
I did not modify my config.yaml
Also, I left the last automation section you outlined way back when in the automations.yaml - and that’s where I added the google.tts information
So hopefully I’m set!!!
Thank you
1 Like