Hi All, I have some data-inconsistencies I’m hoping you can help me with.
I have two strings setup in SolCast. One points mostly south, one points mostly west.
SolCast is properly showing this in the individual Sites. If you look at the forcast chart, the West chart peaks later in the afternoon:

My first observation is that the Solcast integration is not properly merging the two strings.

Solar noon is at 1:40pm in Atlanta today, but SolCast is forcasting ‘Peak Time Today’ at 1:00pm

First, the time for ‘Peak time’ is oddly a round number. I would think that should be closer to solar-noon.
Actually, it should be well-past solar noon on account of my west-facing panels.
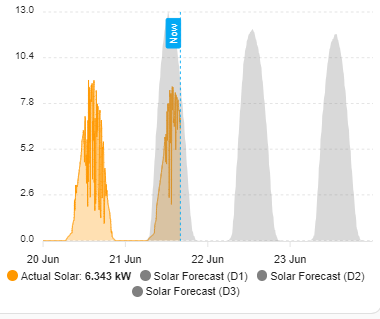
I am not seeing a West facing tilt in this chart, and I do dramatically overproduce in the afternoon.:

Total forecasted energy does seem to include my full array, these numbers feel right: (currently 4:oopm)

And what I think is a separate issue, the forecasts are grossly inflated when I look at the forecast in ApexCharts:
Apex Charts are configured with:
  - entity: sensor.solcast_pv_forecast_forecast_today
    name: Solar Forecast (D1)
    extend_to: false
    color: grey
    opacity: 0.3
    stroke_width: 0
    yaxis_id: kWh
    show:
      legend_value: false
      in_header: false
    data_generator: |
      return entity.attributes.detailedForecast.map((entry) => {
            return [new Date(entry.period_start), entry.pv_estimate*2];
          });
Does anyone have tips for improving the accuracy of SolCast forecasts?
I was curious about the *2 multiplier in the data_generator, but removing that shows the forecast dramatically underestimated.

I would like to 1: ensure the west-facing panels are considered, it appears they are not, and 2: correct the overestimation in the Apex-Chart graph.