Found the solution on github - delete the solcast.json file in the config directory and reload the integration and it will spring back to life
What did you find to change, i have this problem also?
also make sure you have set up an automation to trigger the forecast updates (as above in the thread) - the integration no longer does that itself
1 Like
I realy like the dampening function concept as the 2 hours before sunset are usually a bit lower than forcast. The time of 1-2 hours before sunset is going to change thoughout the year, so I’m not sure how to actually implement it.
I need to remove the first part of the day from the forecast in winter due to shading, any idea how to add up the first x hours of the forecast for a day?
Hi there, first of all a very nice integration. Still kind of new to this, so sorry if this is a stupid question. Is there anyway of getting the estimated solar production in 2 hours, in 3 hours, etc. so that these are all separate sensor values? I would like to send these values to my Loxone automation server.
That’s all there (I think) in the attributes under Today’s forecast, so it’s available but if have to use Template Sensors or similar to surface the into your Dashboards…
I use this (prob borrowed from this thread) to show me half hourly forecast over next few days…its not separate sensors but works for me…
- type: horizontal-stack
    cards:
      - type: markdown
        content: >
          <font color=orange> <b>Time - kWh</b> {%- set results =
          state_attr('sensor.solcast_pv_forecast_forecast_today',
          'detailedForecast')  %} {%- for record in results %} {%- set ts =
          as_timestamp(record.period_start) %} {%- if record.pv_estimate > 0 %}
           {{ ts|timestamp_custom ('%H:%M', local=true) }} - {{ record.pv_estimate | round(2) }}
           {%- endif %}
          {%- endfor %}
        title: Today
      - type: markdown
        content: >
          Time - kWh {%- set results =
          state_attr('sensor.solcast_pv_forecast_forecast_tomorrow',
          'detailedForecast')  %} {%- for record in results %} {%- set ts =
          as_timestamp(record.period_start) %} {%- if record.pv_estimate > 0 %}
           {{ ts|timestamp_custom ('%H:%M', local=true) }} - {{ record.pv_estimate | round(2) }}
          {%- endif %} {%- endfor %}
        title: Tomorrow
      - type: markdown
        content: >
          Time - kWh {%- set results =
          state_attr('sensor.solcast_pv_forecast_forecast_day_3',
          'detailedForecast')  %} {%- for record in results %} {%- set ts =
          as_timestamp(record.period_start) %} {%- if record.pv_estimate > 0 %}
           {{ ts|timestamp_custom ('%H:%M', local=true) }} - {{ record.pv_estimate | round(2) }}
          {%- endif %} {%- endfor %}
        title: Next
2 Likes
- platform: template
  sensors:
    # Replace with the desired sensor name for the first item in the list
    sensor_1:
      friendly_name: "Sensor Name 1"
      value_template: >-
        {{ state_attr('sensor.your_sensor_entity_id', 'your_attribute_name')[0] }}
      # Add unit_of_measurement if applicable

    # Replace with the desired sensor name for the second item in the list
    sensor_2:
      friendly_name: "Sensor Name 2"
      value_template: >-
        {{ state_attr('sensor.your_sensor_entity_id', 'your_attribute_name')[1] }}
      # Add unit_of_measurement if applicable

    # Continue for additional items in the list
Wasn’t my Q originally but…wouldn’t that be just how to extract an attribute from a sensor, but not sure that’s what they’re asking…what I’d taken from we post was how to show forecast in X hours from now so it’s a little more involved I think (and even then doesn’t the forecast sensor here bundle the whole days hourly forecast into one attribute called DetailedHourly, or am I misunderstanding that)
Thanks, but not quite what I was looking for. In Gav_In’s next post he explains it better. I also think there might be more involved as I will also need to get the current time of the home assistant server, find the next hour in the file, then save that in the sensor value. I did see that the detailed forecast is done every 30 minutes, so ideally I would average the 2 values within that hour.
Any idea’s would be more than welcome.
1 Like
As new to HA, where to get startet to learn all this fancy stuff.
Have HACS+Growatt+SolCast enabled.
Can you please tell me where to paste the second portion? Thanks for this card!!
Thank you very much almost copied this here, changed 2 inputs and all is working flawlessly!
https://community.home-assistant.io/t/solcast-global-solar-power-forecast-integration/334681/221?u=sleepymaxx
Has anyone managed to create a bar chart of the forecasted values for the next 7 days? This was as good as I could get.
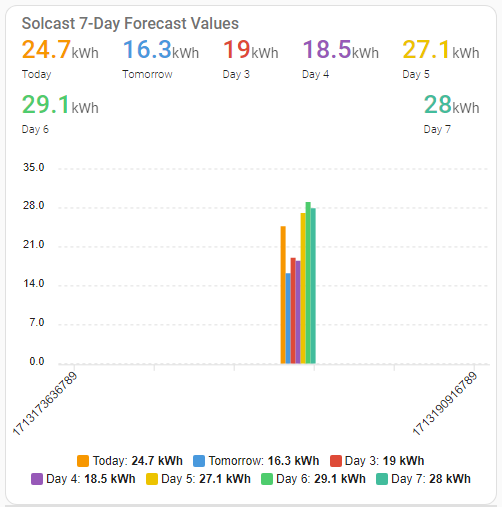
I use this…prob borrowed somewhere off this thread originally so all credit as due…
It’s displayed as a line rather than a bar but you can change that easily enough if you want to
(card is nested into an Expander Card so ignore/remove that if you don’t want it)
type: custom:yet-another-expander-card
cards:
  - type: vertical-stack
    cards:
      - type: custom:apexcharts-card
        apex_config:
          chart:
            height: 350px
        all_series_config:
          unit: ' kWh'
        header:
          title: Solar Next 7 Days
          show: true
          standard_format: true
          show_states: true
          colorize_states: true
        graph_span: 7d
        span:
          start: day
          offset: '-0h'
        now:
          show: true
          label: Now
        yaxis:
          - id: kwh
            min: 0
            apex_config:
              tickAmount: 5
          - id: header_only
            show: false
        series:
          - entity: sensor.solcast_pv_forecast_forecast_today
            yaxis_id: kwh
            type: area
            name: Today
            color: orange
            data_generator: >
              var today = entity.attributes.detailedForecast.map((start, index)
              => {
                return [new Date(start["period_start"]).getTime(), entity.attributes.detailedForecast[index]["pv_estimate"]];
              });

              var data = today

              return data;
            show:
              legend_value: false
              in_header: false
            stroke_width: 3
            float_precision: 2
            extend_to: false
          - entity: sensor.solcast_pv_forecast_forecast_tomorrow
            yaxis_id: kwh
            type: area
            name: Tomorrow
            color: yellow
            data_generator: >
              var today = entity.attributes.detailedForecast.map((start, index)
              => {
                return [new Date(start["period_start"]).getTime(), entity.attributes.detailedForecast[index]["pv_estimate"]];
              });

              var data = today

              return data;
            show:
              legend_value: false
              in_header: false
            stroke_width: 3
            float_precision: 2
            extend_to: false
          - entity: sensor.solcast_pv_forecast_forecast_day_3
            yaxis_id: kwh
            type: area
            name: Next Day
            color: green
            data_generator: >
              var today = entity.attributes.detailedForecast.map((start, index)
              => {
                return [new Date(start["period_start"]).getTime(), entity.attributes.detailedForecast[index]["pv_estimate"]];
              });

              var data = today

              return data;
            show:
              legend_value: false
              in_header: false
            stroke_width: 3
            float_precision: 2
            extend_to: false
          - entity: sensor.solcast_pv_forecast_forecast_day_4
            yaxis_id: kwh
            type: line
            name: + 4
            color: green
            data_generator: >
              var today = entity.attributes.detailedForecast.map((start, index)
              => {
                return [new Date(start["period_start"]).getTime(), entity.attributes.detailedForecast[index]["pv_estimate"]];
              });

              var data = today

              return data;
            show:
              legend_value: false
              in_header: false
            stroke_width: 3
            float_precision: 2
            extend_to: false
          - entity: sensor.solcast_pv_forecast_forecast_day_5
            yaxis_id: kwh
            type: line
            name: + 5
            color: grey
            data_generator: >
              var today = entity.attributes.detailedForecast.map((start, index)
              => {
                return [new Date(start["period_start"]).getTime(), entity.attributes.detailedForecast[index]["pv_estimate"]];
              });

              var data = today

              return data;
            show:
              legend_value: false
              in_header: false
            stroke_width: 3
            float_precision: 2
            extend_to: false
          - entity: sensor.solcast_pv_forecast_forecast_day_6
            yaxis_id: kwh
            type: line
            name: + 6
            color: grey
            data_generator: >
              var today = entity.attributes.detailedForecast.map((start, index)
              => {
                return [new Date(start["period_start"]).getTime(), entity.attributes.detailedForecast[index]["pv_estimate"]];
              });

              var data = today

              return data;
            show:
              legend_value: false
              in_header: false
            stroke_width: 3
            float_precision: 2
            extend_to: false
          - entity: sensor.solcast_pv_forecast_forecast_day_7
            yaxis_id: kwh
            type: line
            name: + 7
            color: grey
            data_generator: >
              var today = entity.attributes.detailedForecast.map((start, index)
              => {
                return [new Date(start["period_start"]).getTime(), entity.attributes.detailedForecast[index]["pv_estimate"]];
              });

              var data = today

              return data;
            show:
              legend_value: false
              in_header: false
            stroke_width: 3
            float_precision: 2
            extend_to: false
          - entity: sensor.solcast_pv_forecast_forecast_today
            yaxis_id: header_only
            name: Today
            color: orange
            show:
              legend_value: true
              in_header: true
              in_chart: false
          - entity: sensor.solcast_pv_forecast_forecast_remaining_today
            yaxis_id: header_only
            name: Remaining
            color: orange
            show:
              legend_value: true
              in_header: false
              in_chart: false
          - entity: sensor.solcast_pv_forecast_forecast_tomorrow
            yaxis_id: header_only
            name: Tomorrow
            color: yellow
            show:
              legend_value: true
              in_header: true
              in_chart: false
          - entity: sensor.solcast_pv_forecast_forecast_day_3
            yaxis_id: header_only
            name: Next Day
            color: green
            show:
              legend_value: true
              in_header: true
              in_chart: false
          - entity: sensor.solcast_pv_forecast_forecast_day_4
            yaxis_id: header_only
            name: Day 4
            color: green
            show:
              legend_value: true
              in_header: true
              in_chart: false
          - entity: sensor.solcast_pv_forecast_forecast_day_5
            yaxis_id: header_only
            name: Day 5
            color: grey
            show:
              legend_value: true
              in_header: true
              in_chart: false
          - entity: sensor.solcast_pv_forecast_forecast_day_6
            yaxis_id: header_only
            name: Day 6
            color: grey
            show:
              legend_value: true
              in_header: true
              in_chart: false
          - entity: sensor.solcast_pv_forecast_forecast_day_7
            yaxis_id: header_only
            name: Day 7
            color: grey
            show:
              legend_value: true
              in_header: true
              in_chart: false
title: Energy Graphs
title-card:
  type: markdown
  content: |
    # **Solar Next 7 Days**
Thanks for that example, but I was hoping to get the y-axis to display the total value for the day rather than the individual 30 min values

Hello
I uninstalled my solcast integration correctly from HACS, because i have a litte problem
i reboot, reinstal the last version
But when i want add in the integration panel it says me thats it is not possible
Only one session is permited…
I dont have the solcast.json file in /ha/config… to delete
Thank’s for your help
I post the same message in
Sorry
Hello
I try hundred method for installl reilstal etct etc… but always the same results

I don’t know where the information could be modfied
If you have some idea
Thank’s
Regrete fully des not possible to use the integration with two or more Accounts , so it is not possible to use it with more than one plant with two orientations.