Great water use graph, Thank you for the awesome work.
I do however have a suggested enhancement; The water use graph and the energy use graph need a differentiator for who was using the device at the time.
It is fairly simple to identify a person is using a device; Bob is in the bathroom so all bathroom water devices are consumed by Bob. Anna logged into the gaming rig so is consuming all the gaming rig power. etc.
Automations can adjust tags or something on the devices to indicate who was consuming, just need a way to display this in the graph as a further split of identified use.
Thanks again for a geat release!
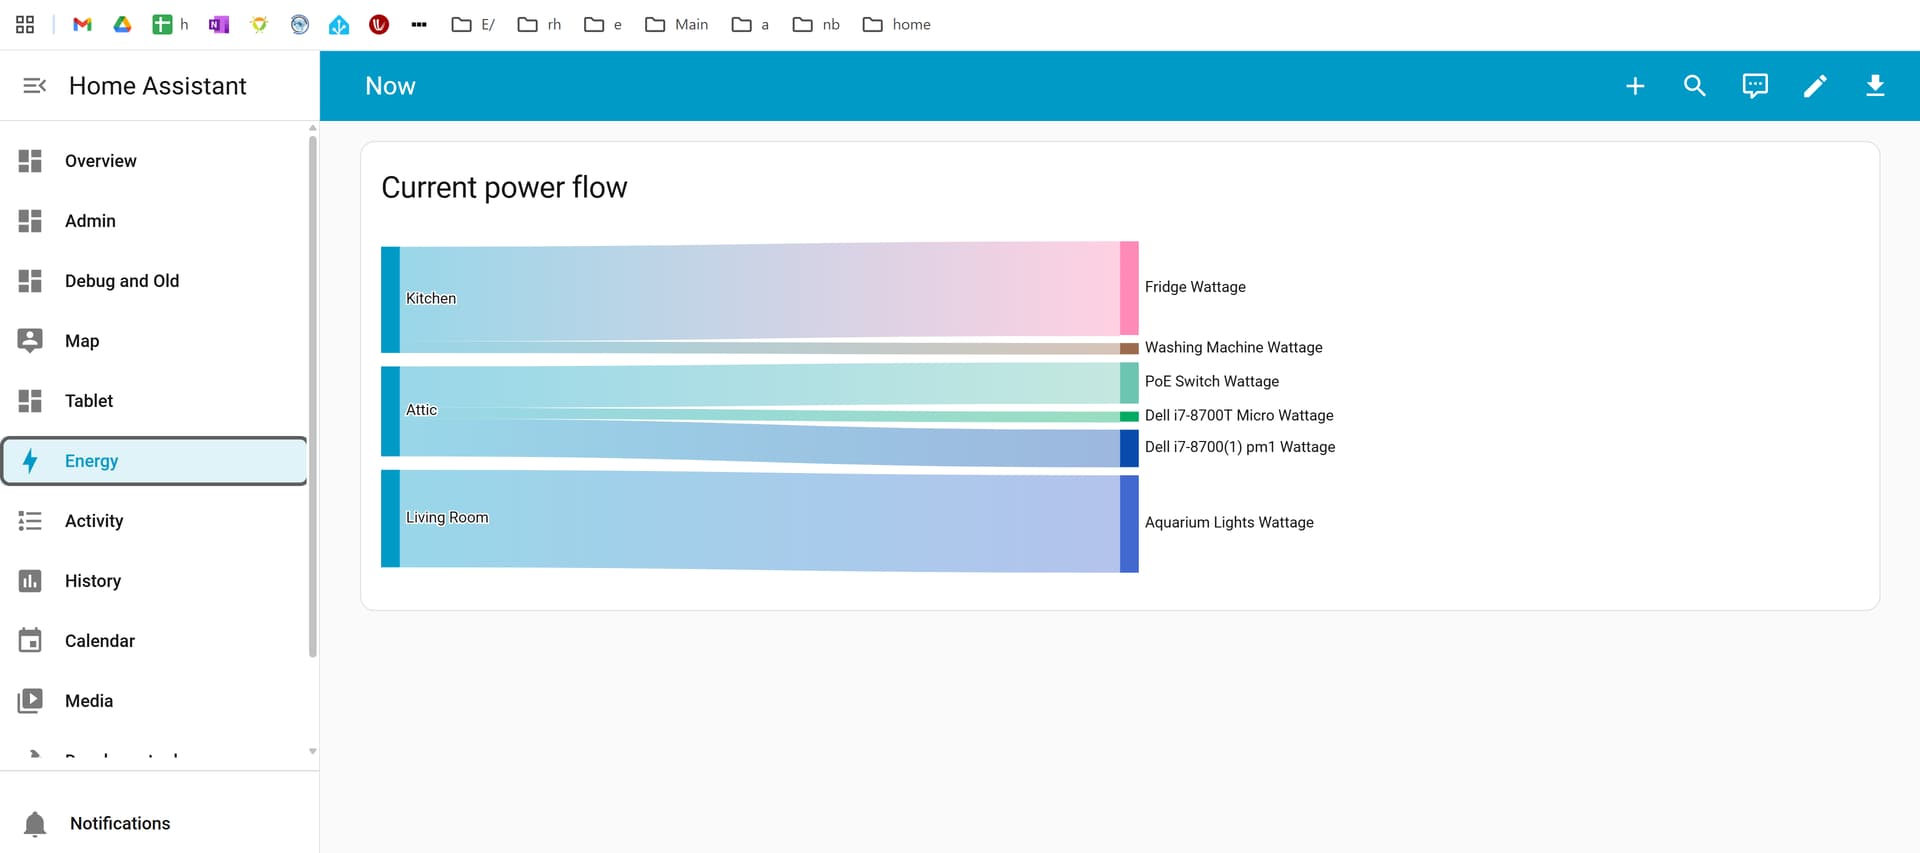
you mean this…
yes it is bugged, and 100% core HA .
  - type: markdown
    content: >
      <img src='/local/images/mowas.png' width='35'> [Live Warnmeldungen übersicht](https://warnung.bund.de/meldungen)
Thanks for support tom
That’s a huge work, I played a bit try to understand better
Again: I spent time ( believe me I f I say months over months) a a lot of efforts to learn and buld up my view as much as possible “standard” try to mitigate maintenance when needed.
But in this spefic issue , it means to restart from zero >>> unbelieveable
Give you an example:
- till 2025.11.3 - Entities card column 6 row auto or 1 or 2 it depends >>> this is the right config for tablet >> you see 2 entity card one next the other >> perfect ( for me )
- I perform all config on My desktop PC and then open tablet view to see result
- No additional config is needed the resize was automatically done in right way
- 2025.12
- based on yur suggestions I played around that:
- always config start from PC ( never used tablet for that) :
- entity card now are column 9 the same row, you need to resize the sections
- Dimension card text font ( name and state use different size ) resizing works completely different on tablet with Companion App
- Zoom is always at 100%, I prefer to use it as my last last last option
After this update, my HA is taking a really long time to restart, am i the only one? Running HAOS in Proxmox!
Same here, the update went ok, but the HA isn’t back, but i can see the terminal server is running in the proxmox, i can acess, send commands! But no frontend!
Am I the only one who sees a very limited Energy dashboard?
There is only one tab (called “Now”), no history, only immediate power flow consumption of few devices.
Tried clearing browser cache, the same.
Same in Google Chrome and Edge
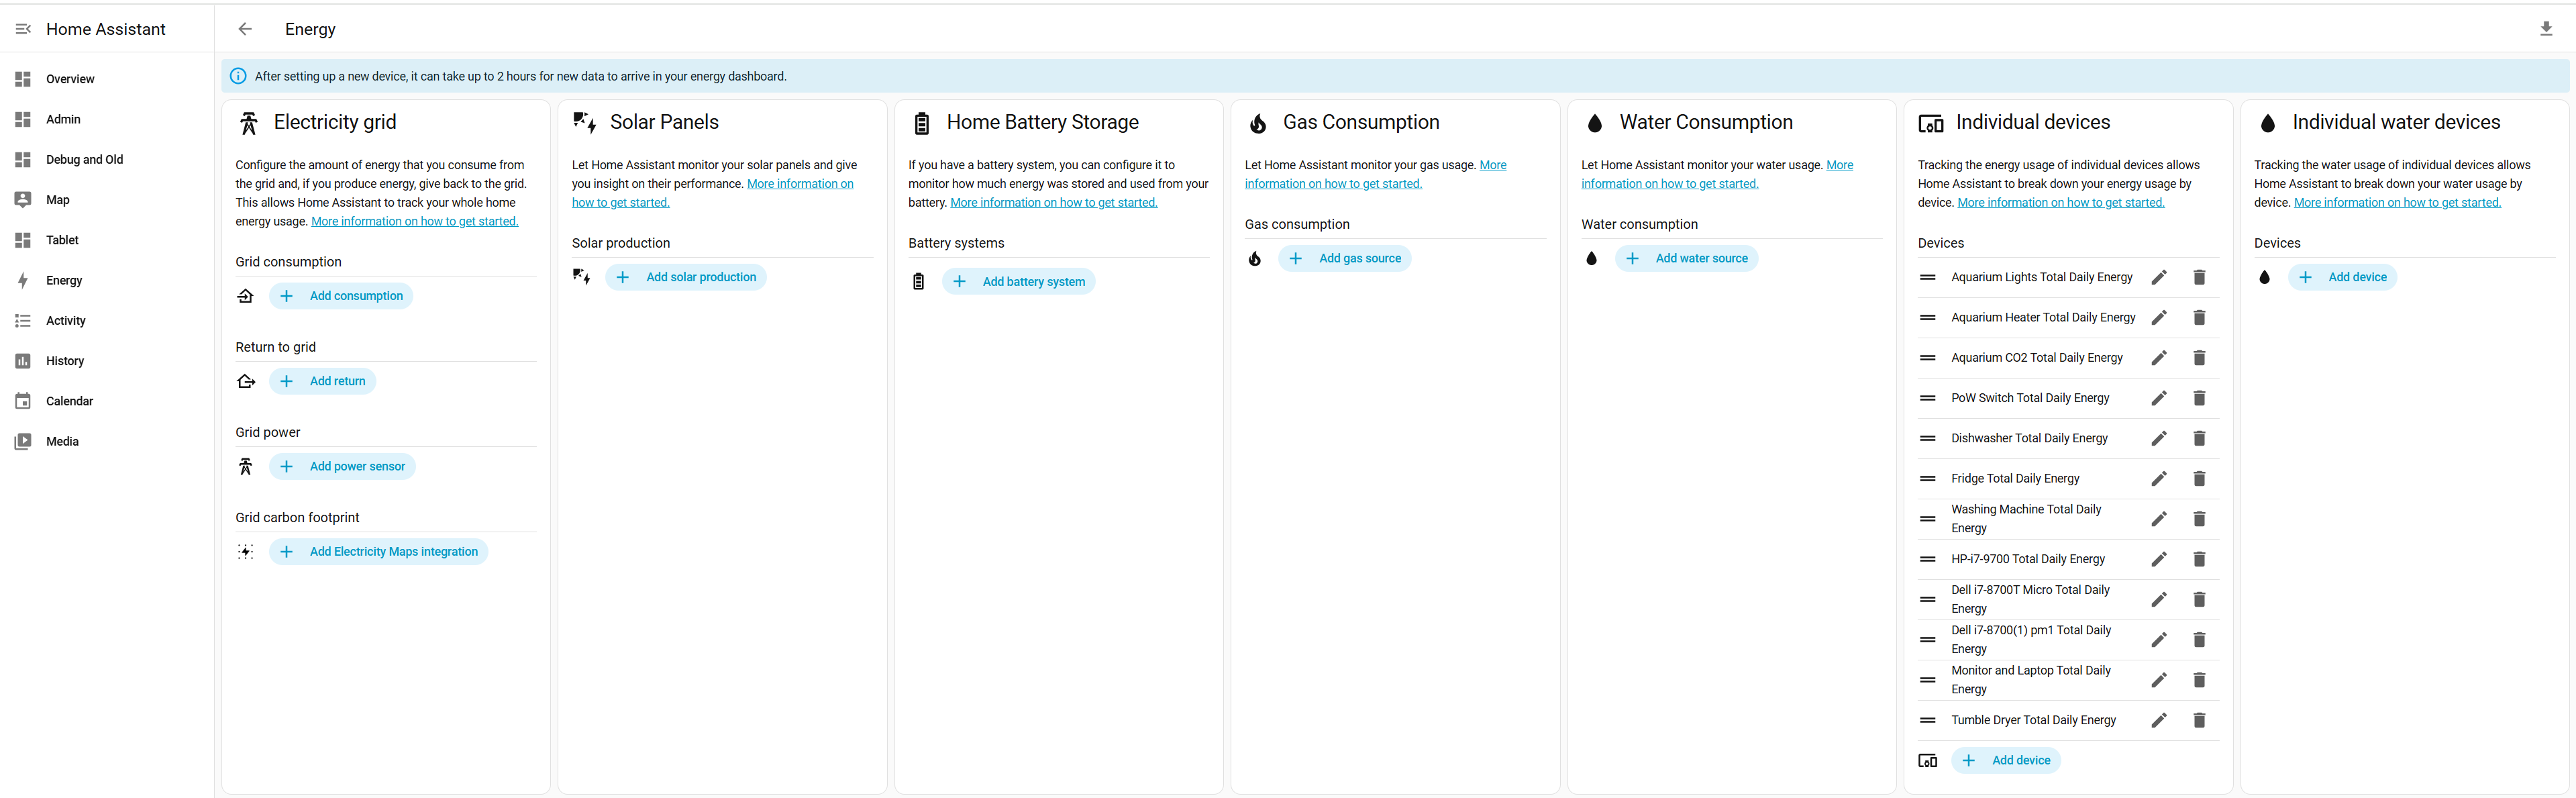
Check to see if your devices have been removed in the Energy settings. It’s been reported that updating to 2025.12.0 had reset everything.
Same. Can access via CLI and system reports all OK. I actually noticed that running ‘info’ in the CLI still showed 2025.11.3 so I guess something went wrong during the upgrade process. I updated again via de CLI and after waiting and rebooting the host I was back up, but that was about 5 minutes ago. Still not sure what the issue was/is
Just spotted this: Homeassistant stopped working : also backup doesn't look to work - #17 by remcohn
Where is the documentation on how to use the built-in dashboards. I just upgraded to 2025.12 and wanted to copy them and customize them, but I can’t find any documentation on how to do this.
Afaik, it’s no longer possible. It was explained by the devs in the release party. Built-in dashboards are now fully auto-generated.
So far I have one issue with this version. I have 3 devices with my own account in HA and since this version the default Dashboard in the account is used for all the devices, where as before it was per device. So when I set it on Home on my laptop and wall tablet it’s ok there, but when I open the companion app on my phone it also uses that dashboard where I normally have a separate Phone dashboard. When I go back in the user settings the dashboard option is empty.

1 Like
Have you waited the 2 hours shown? As mentioned, everything had reset, so you’ll have to wait till they reappear again. If they still don’t show, I’d recommend reporting and issue on github.
Any chance you can give me the timestamp where they discussed this in the release party video?
From the release blog: If you set your phone to one dashboard and your wall tablet to another, they’ll now both revert to the default dashboard. If you want your wall tablet to use a different dashboard than your other devices, we recommend giving it a separate user profile that you can customize however you want
I setup duplicate admin user profiles for my phone and tablet
2 Likes
It would be much easier to read the values (e.g. 9 W instead of 0,009 kW) if the units were displayed automatically instead of just kW.
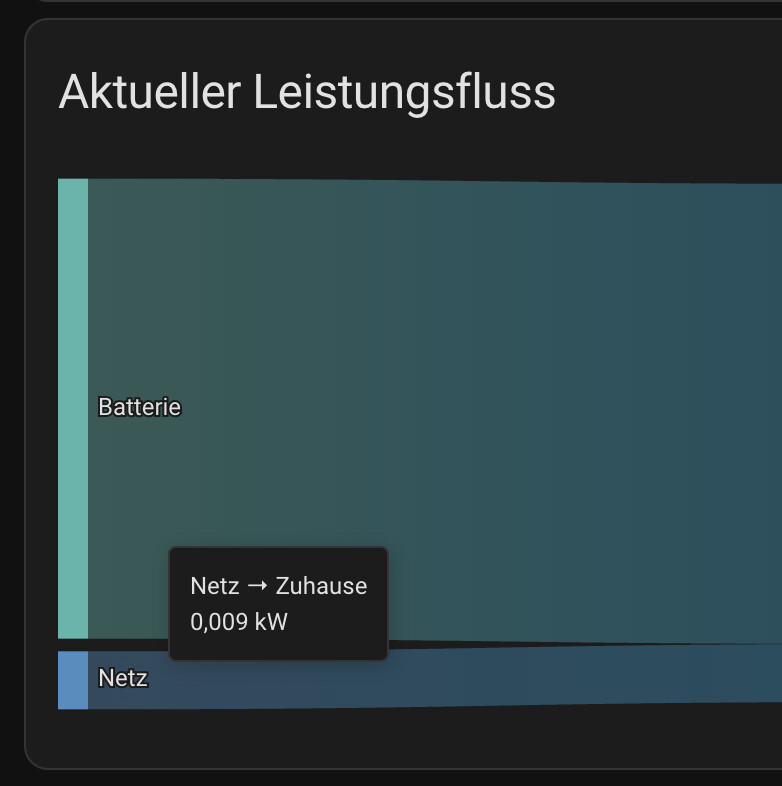
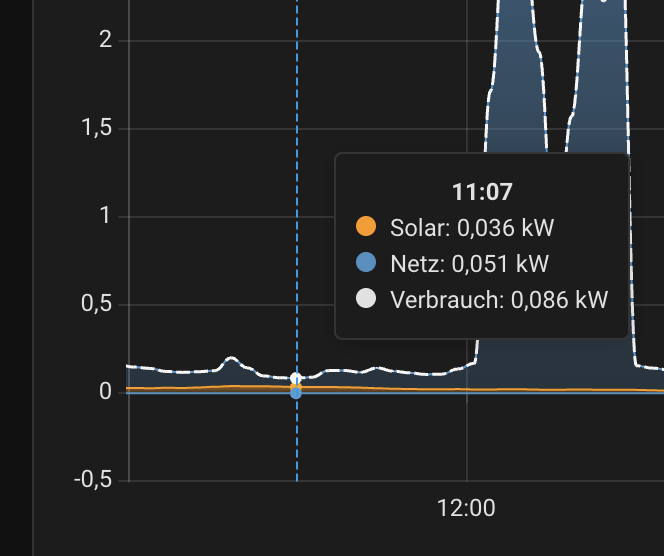
5 Likes
Thanks for the quick answer. I just noticed it in the release notes, but to be honest, that makes no sense at all. On my wall dashboard I use full kiosk browser, so I can force it to use a specific dashboard, so that part is fixed now. I’m sure a lot of people use different dashboards on different devices without using separate accounts. I hope they revert it.
6 Likes
This is a bug when you have devices only, check back in .1
Or add a dummy grid sensor temporarily until it is resolved.
1 Like
Yes, sure. The dashboard was working fine on 2025.11 before the update to 2025.12. Updated yesterday. I thought maybe it will fix by itself over time, but it didn’t.