Hi Frenck,
can it maybe be done if i allow anonymous login? I don’t have any problems with that since grafana and home assistant is only accesable from within my LAN.
If so, how can i change the settings in grafana? I’m trying all day to change the settings (in the grafana.ini), via env variables and stuff, but can’t seem to find a way that works.
Greetings,
Joost
Okay, I’m able to make the iframe working like this. AFAIK, you can’t get ingress to work, so it won’t pass through nabu casa when you don’t have direct access. To remedy this, you’d have to punch a whole in your firewall for the port you define and use your external ip and port in the URL. Probably you only need anyonymous and embedding, but I just copy pasted that from elsewhere.

I just showed up to this issue and wanted to chime in. On my internal network, on mac safari 14, sometimes works and other times not, on the iOS HA app it always give an error - I get 401: Unauthorized on Grafana iframe card, but on Google Chrome, it always works on the mac but never on the iPhone. could there be some other way to integrate Grafana into lovelace besides the iframe card?
1 Like
Yes just to chime in this is the 1M$ question… What is the right way of displaying Grafana dashboards in Lovelace? Any support appreciated. And if it is not possible at all then I don’t really get the point of having a Grafana addon…
3 Likes
any solution to this? All charts are now showing 401: Unauthorized
Solved! Got it working by doing mainly two things:
On my settings I changed:
grafana_ingress_user: anonymous
And on the shared link to the plot, I changed the url port to 3000, like below:
http://192.168.1.6:3000/api/hassio_ingress/whatevertoken/d-solo/7Tl95WoGz/server-stats?orgId=1&refresh=1m&from=now-1h&to=now&panelId=3"
Since then, no “Unauthorized access”
3 Likes
Thank you for solution. What about accessing from another network (actually from world wide)? Do i have to port forward somehow that port 3000 ?
Hi, can you tell me where this setting is please?
Supervisor - grafana - configuration
As i understand, with this config i cant get assess from outside. Any advice to make it work thrue original dns?
Funny part is that i can see on my mobile HA app the grafana dashboard through wi-fi, although webcard is through ddns, but on local instance (with web browser) of HA in lovelace i see 401:unauthorised
Any news for solve this problem??
If you are using Grafana in supervisor:
These settings work for me…

plugins:
  - grafana-worldmap-panel
env_vars:
  - name: GF_INGRESS_USER
    value: anonymous
  - name: GF_DEFAULT_INSTANCE_NAME
    value: Hassio
  - name: GF_AUTH_ANONYMOUS_ENABLED
    value: 'true'
  - name: GF_SECURITY_ALLOW_EMBEDDING
    value: 'true'
  - name: GF_SECURITY_COOKIE_SAMESITE
    value: none
  - name: GF_SECURITY_COOKIE_SECURE
    value: 'true'
  - name: GF_SECURITY_LOGIN_REMEMBER_DAYS
    value: '365'
  - name: GF_AUTH_BASIC_ENABLED
    value: 'true'
ssl: false
certfile: fullchain.pem
keyfile: privkey.pem
log_level: info
I also changed to port 3000:
The webpage panel card link in lovelace frontend: http://192.168.1.4:3000/api/hassio_ingress/blah/blah…
2 Likes
Does it also work externally then? Via nabu casa? They do not forward port 3000 do they?
Canne help with Nabu Casa as I don’t use it. Sorry.
But it does work “externally” via VPN which is in essence “local”.
(I don’t use https and don’t expose HA direct to web)
Its pretty quick to just pop on an OPENVPN connection on a mobile or laptop to check into HA when out and about.
It’s also good to pop the VPN on when on an unknown WIFI (Instead of NORD or something similar you pay for) so your web browsing goes via the home internet.
Telegram messenger is also integrated into HA with a chat bot (RedBot Nodes) to send commands to HA and to report stuff back to users in a chat without putting VPN on.
Someone else may be able to test the Nabu Casa element for you…
Hm… obviously adding a separate port to the container and enabling anonymous access solve the issue… but this mean indeed that internally it is solved (which includes vpn acces to your internal).
And also pinning a hole in the firewall to that port enables “local”/“direct” access to the container.
But al these options are not really “handy” to do and ton maintain. The best would be to access the container internally which makes it work locally and remote (via 8123 and nabucasa)…
having the same problem myself. I’ve tried exposing the container port and enabling anonymous and of course that works. However I don’t want to expose grafana port to the world and having anybody able to connect to it. Is there any way we can make it working on hassio standard port?
I’d be fine having to generate a token once every year that’s why I tried with a config like this
plugins: []
env_vars:
  - name: GF_SECURITY_ALLOW_EMBEDDING
    value: 'true'
  - name: GF_AUTH_ANONYMOUS_ENABLED
    value: 'false'
  - name: GF_AUTH_TOKEN_ROTATION_INTERVAL_MINUTES
    value: '525600'
  - name: GF_AUTH_LOGIN_MAXIMUM_INACTIVE_LIFETIME_DAYS
    value: '365'
  - name: GF_AUTH_LOGIN_MAXIMUM_LIFETIME_DAYS
    value: '365'
ssl: true
certfile: fullchain.pem
keyfile: privkey.pem
but unfortunately it doesn’t do the job 
Yeah exposing anon login for grafana to the world isn’t something I’d do on my firewall.
Hence using VPN for remote access.
Sorry it wasn’t of any use pal. But someone else may find it of use.
I’m sure someone will fix the :8123 port issue in time 
simple workaround:
- set grafana graphics from dashboards with external url ;
- at first instance when u try to view grafana, steb in grafana add-on sidebar for this to authenticate ;
- after grafana loads there u can go your whole session in that webpage or companion and graphics will be there
Try to add additional parameters here, near of "GF_AUTH_ANONYMOUS_ENABLED" in Grafana configuration:
  - name: GF_AUTH_ANONYMOUS_ENABLED
    value: 'true'
  - name: GF_AUTH_ANONYMOUS_ORG_NAME
    value: canBeAnyNameHere
Now it’s working better in my Hassio, but only if connecting to it from same host
I had the same Issue (401 unauthorized) in the iFrame in a dashboard. Activating Grafana from the toolbar on the left and switching back to the dashboard helps for the second. On a mobile device on same network I always got 401 error.
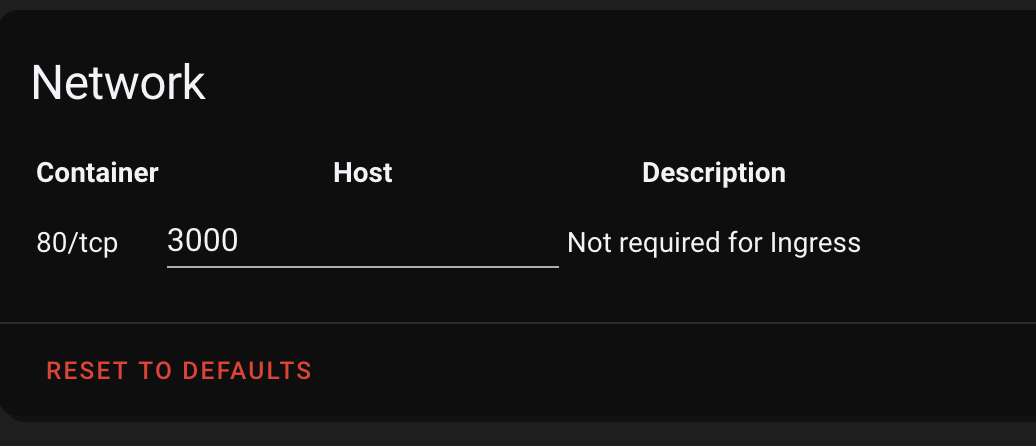
The solution was to change the port in the embed addresse from default 8123 to the one you define in Grafanas settings (3000 on my setup). Credits to @joaofl
3 Likes