I had the same Issue (401 unauthorized) in the iFrame in a dashboard. Activating Grafana from the toolbar on the left and switching back to the dashboard helps for the second. On a mobile device on same network I always got 401 error.
The solution was to change the port in the embed addresse from default 8123 to the one you define in Grafanas settings (3000 on my setup). Credits to @joaofl
When I connected to HA using same IP equals IP in URL in iframe, frame work properly/
But when I connected using duckdns.org host or using host from my hosts file, frame show error 401.
None of the above recipes helped.
Same here. Android App with Tablet user isn’t working. Android App with my personal User on Smartphone works perfectly fine, also with my personal User on the PC browser.
Would be interesting to get this resolved for all devices.
Hi, I have posted alternative solution for iframe with Grafana.
If you are running Home Assistant and Grafana on a reverse proxy and SSL enveronment, this might be useful.
Enabling anonymous login fixes this issue with setup like below but creates security problems. One way to fix that from HA side is to introduce sending additional headers for lovelace iframe card.
Grafana api keys can be used like this:
Then grafana api keys can be used but this also creates other security issues since the api key will be visible for everyone who can access the lovelace dashboard. Though it is a less severe issue than completely exposing grafana with anonymous login since if someone unwanted can access your dashboard, you will have other problems.
This can also be mitigated by using secrets in the lovelace ifrane card to some degree too.
I have the same issue.
I get an 401: Unauthorized error on a first opening lovelace page.
I have to open a grafana panel first and then I have to refresh a lovelace page
Same 401 issue… 2022.8.3.
I saw many different solutions out there, but… I’m a bit confused: after years of HA-Grafana integration… isn’t there, yet, a straight direction to solve an issue that ANYONE using Grafana in HA would have? I mean… anyone using Grafana - I think - would then add his graphs within the other dashboards… no?
I also have this issue and I’m sad there’s no nice solution.
Right now I’m just manually opening Grafana (so that I’m somehow authenticated) and after that it works … (for 1 day).
What is the adress you are using in the card ?
Mine is like this https://externalIP:3000/
you need to redirect the port to your server.
If you’re using SSL, don’t forget to indicate the adress of it. If you use NPM it is not / but /nginxproxymanager/live/npm-5/privkey.pem
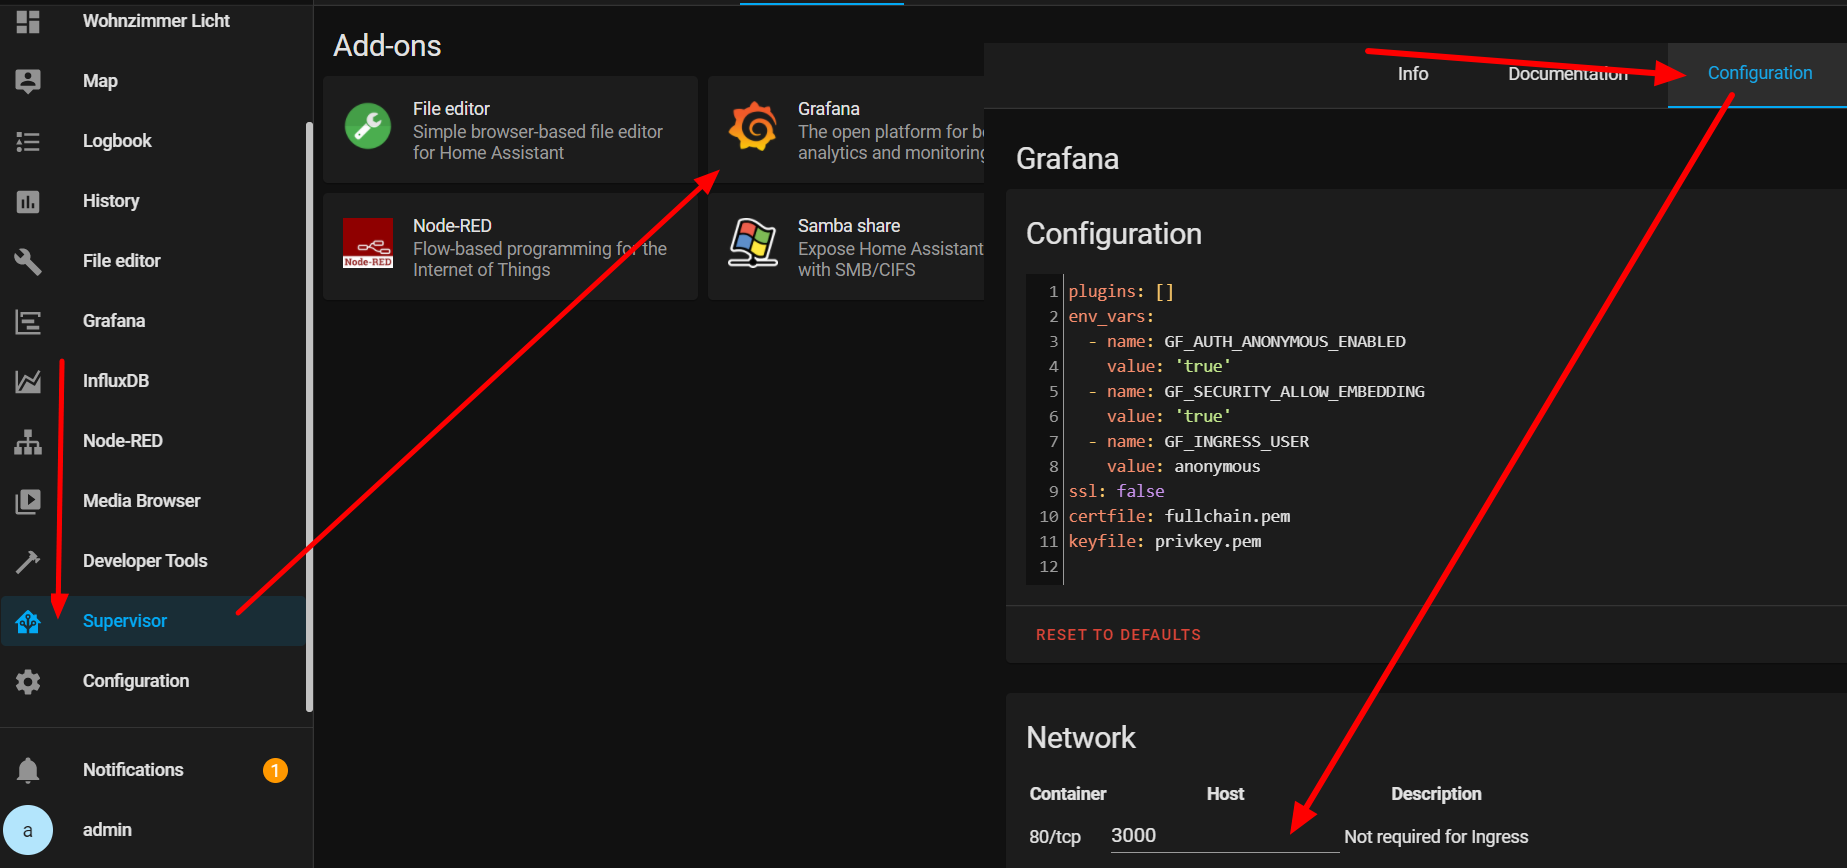

 simply type “3000” (or whaterever 4digit number you like) instead “disabled” like I did